2025 App marketing strategy your dashboard doesn’t want you to know


Hey friends, Ernest Lebedev here 👋 I’m a performance marketer focused on mobile growth, especially in the Chinese app market, where speed, scale, and volatility are the daily norm. Over the past few years, I’ve led UA for apps and games on platforms like OceanEngine, Kuaishou, Tencent, and Mintegral, and worked with creative teams across TikTok, Meta, and Google. Right now, I help teams connect the dots between their dashboards and their actual business results, bringing performance data, team strategy, and market context into one growth loop.
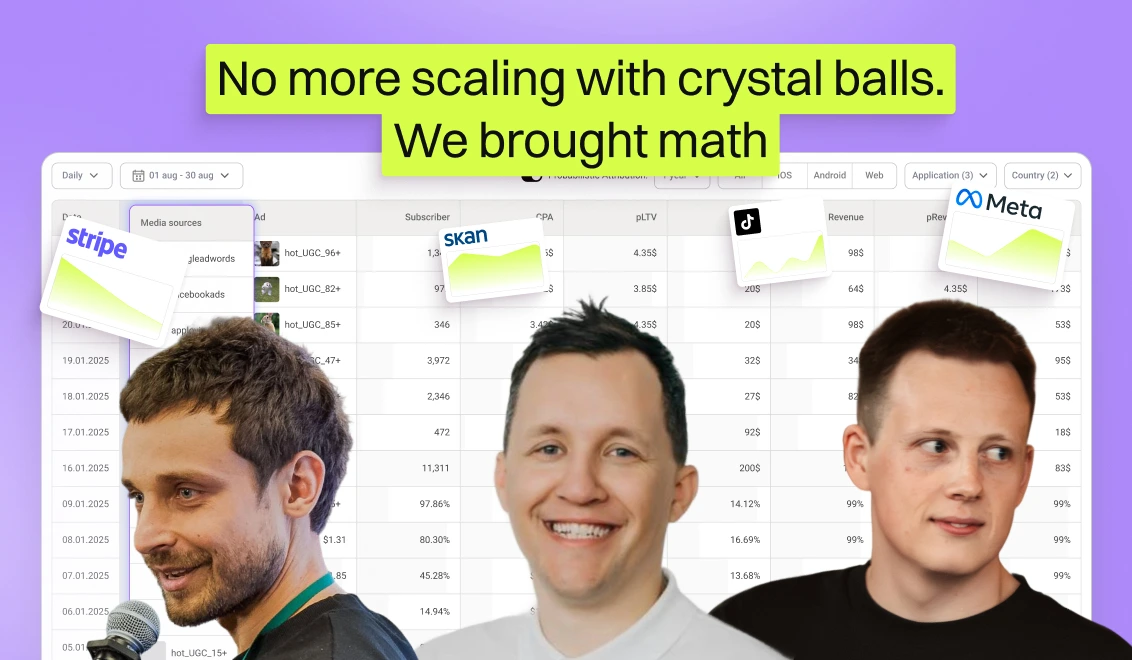
If you’ve ever stared at your BI tool wondering why your predicted LTV doesn’t match what's actually hitting the bank, this one's for you.
Here's the thing: predictive metrics are essential. They're your early signals, your speed dial, your sanity when scaling. But in 2025, they're not enough on their own. The real magic happens when you can read those predictions in context: check them, compare them, and blend them with live user behavior.
That's what we're digging into today. What actually works now? The predictive metrics that matter most and the real-world signals every growth team should layer on top. If you're trying to make smarter budget calls, spot waste early, and scale the good stuff faster, keep reading.

Key predictive metrics for the 2025 app marketing strategy
Alright, let's start with the juicy stuff: the predictive metrics that actually pull weight in 2025. These are the ones you want at your fingertips when you're staring down a scaling decision or planning your next UA sprint:
- LTV: Still a prediction that might become true. Nonetheless, knowing what a user brings in over time (not just day 1) is what separates performance marketers from gamblers.
- Predicted revenue profitability: Not every user is worth the same. This tells you who's likely to bring in long-term value, not just trial and churn.
- Predicted re-conversion rates: For apps with IAP or subscriptions, this is your signal of stickiness. If a user comes back to buy again (and again), that's where your margin lives.
These signals help you move quickly, test efficiently, and scale with some confidence. But, and it's a big one, relying only on them? That's where things can go sideways.
I've seen it happen. Everything looked promising within predictive metrics: great LTV, CAC, and conversion estimates to trial were also within the usual range. Scale was the obvious thing to do. But here’s the twist: real metrics told a different story. Refunds spiked. Conversions of paid users fell off a cliff. Unfortunately, the scale didn't work out as it was expected. By the time the quarter ended, the responsible UA manager missed his targets and got blamed for the miss.
So yeah, these metrics matter for your application marketing strategy to be more than just optimistic modeling. But they need backup. Real-world context is your fail-safe. That's the difference between wishful scaling and confident scaling.
Now let's talk about the five real-world metrics that turn your forecasts into something you can actually act on. You don't throw them out. You cross-check them with real-world behavior, fast.

The real 5: metrics that add context to your predictions
1. Refund rate trends
Your LTV model might look golden on paper, but if 20-30% of those "valuable" users are refunding, it’s a fool's gold. Refunds are often a proxy for misaligned expectations or predatory onboarding tactics that don't scale. Track refunds per cohort and look for spikes, try to match this ubnormal user behavior with traffic fluctuations on platforms, product, paywall changes etc. It is crucial to find correlation or, at least, causation to act upon. High refund rates don't just distort revenue, they might show the real value of your product to a user and slowly but surely burn it to ashes.
2. Unsub rates in the first 24 hours
Early drop-offs are your canary in the coal mine. When users bounce right after install, it's a signal that your ad promised one thing and your app delivered another. Or onboarding friction is killing interest. By tracking 24-hour unsubscriptions, you get a window into creative misalignment, onboarding UX issues, paywall pricing, or app performance bugs. Predictive models might still expect revenue from these users, but don't fall for it.
3. Conversion path drop-offs (actual vs. expected)
You've probably mapped your funnel: install → onboarding → trial → paywall → subscription→ paymets→ rebills→ repeat forever. But how many users really follow that flow? Comparing actual behavior with forecasted conversion (2trial, 2paid) steps reveals where expectations fail. If 40% of users hit “skip paywall” and don’t even trial, your forecast for downstream revenue is inflated. Visualizing drop-offs side-by-side with model assumptions is how smart teams course-correct early and keep their app marketing strategy grounded in reality.
4. Trial-to-paid conversions by cohort
You can't manage what you don't segment. Your forecast might show a 30% trial-to-paid average. But break it down by creative, geo, or channel, and you'll often might find swings: 10% in one cohort segment, 50% in another. Predictive models need this granularity to stay relevant. Without segmentation and cohort analysis, you're either overconfident in underperformers or underinvesting in top performers.
5. Conversion estimate variability
Many forecasts provide a single number, but reality has variance. If your predictive model gives you a 10% conversion estimate, ask: what's the confidence interval? Is it 1.5% or 5%? When actuals fall outside that range consistently, it's a sign your model needs recalibration; you might need to increase the sample size to increase accuracy. More importantly, understanding variability helps set smarter budgets and avoid surprise misses.
If users ghost you on day 2, don't blame the dashboard
Here's where we zoom out a bit. We've talked a lot about metrics and models, but all of that hinges on one critical thing: the product itself. Because even the best predictive signals can't fix a product that just doesn't deliver.
Unfortunately, it happens more often than not. A founder gets excited by a good-looking forecast, greenlights big spend, and… nothing. Because the application doesn't actually solve a real problem. Or it's a churn machine, with 30-day retention under 1%. The model says scale, but the users say no thanks.
We all know apps like this. They depend on users forgetting they even subscribed. And when that tactic dries up? Cue the frantic attempts to drive down CPA just to keep the margin afloat.
So yes, models matter. But they're not magic.
And hey, if any product managers or founders have accidentally wandered into this post, welcome. I guess you've made it through the UA part of the funnel 😏
Metrics don't lie, but they do need supervision
This isn't about picking sides: real vs. predictive. It's about how the best UA teams stay sharp. They build feedback loops, not silos. They use forecasts to move fast, and real data to stay honest.
Great growth teams spot trouble early. They don't wait for LTV to tank; they watch refunds and unsub rates, and many other parameters constantly. They sanity-check models with actual user behavior. They know that averages might lie, and cohorts tell the truth.
And most importantly, they stay humble. No model is perfect. No campaign is evergreen. The teams that win are the ones who keep asking: Does this still check out?
So if you're one of those marketers chasing performance without the fluff, may your metrics be clean, your cohorts sticky, and your CAC always just low enough to make the finance team smile.

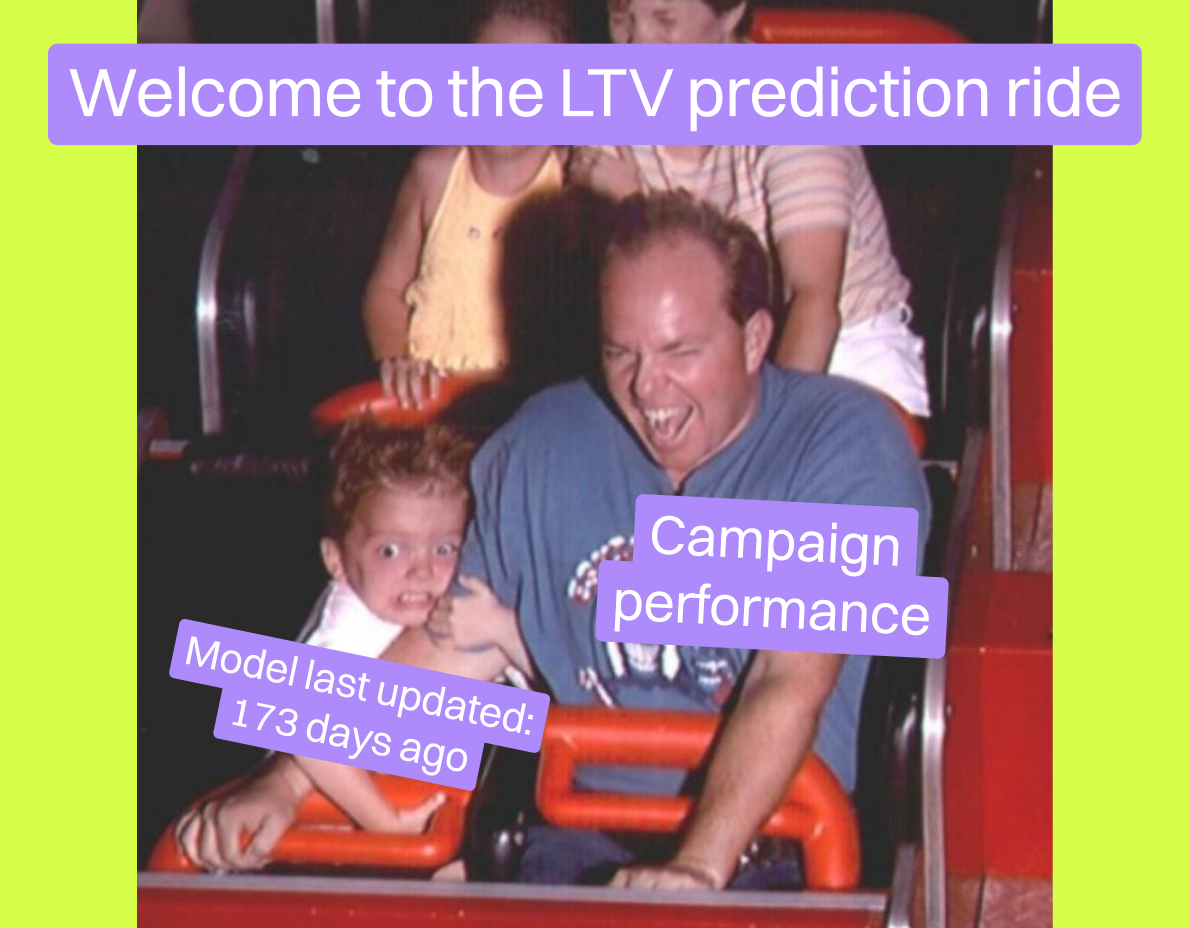
Okay, not all forecasts are tricky. Ours texts you back
Hey there, this is the Campaignswell team jumping in 👋 We've been nodding along with everything Ernest just laid out. Seriously, we've seen the same gaps: teams over-trusting models that haven't caught up, flying blind on stale forecasts, and missing the chance to act before things go sideways.
That's exactly why we built Campaignswell the way we did.
Let us show you how we’re doing predictions differently, stripping away the common pitfalls and building a system that actually supports your app marketing strategy in the real world, not just in theory.
- Money in, money out from day one
Most tools (like PredictSK from AppsFlyer) focus on in-app events to build their forecasts. Campaignswell starts from actual ad spend and revenue. We pull from over 100 sources (Meta, Google, TikTok, Stripe, Paddle, App Store, GA4) and match every dollar spent to every dollar earned. That gives you real pROAS and pLTV, not just modeled estimates.
- Cross-platform, cross-funnel forecasting
Predictive platforms often get stuck inside SKAN or siloed data. We don't. Campaignswell connects web-to-app, Android, iOS, and even hybrid SaaS funnels into a single model. So, whether your user starts on Instagram, signs up via mobile web, and converts in-app three days later, we've got the full picture, and your prediction reflects it.
- Updated as often as you need
With Campaignswell, your forecasts refresh as fast as your data does. You can see cohort performance by day, geo, creative, or platform, and know where your next dollar should go, today, not next week. Teams use this clarity to scale with precision.
- Purpose-built for budget decisions
Other tools, like AppsFlyer, tell you where a user came from. We help you decide where to invest next. That's a critical distinction. Our ML models don't just describe what happened; they help you act: pause unprofitable campaigns, boost high-LTV creatives, and forecast outcomes with confidence.
So yeah, we're a predictive platform. Fine, let's even say we're the 1 LTV predictions platform, if we're being generous to ourselves today. But they were built by UA practitioners who've spent years in the trenches. We've seen every flaky forecast, every mysteriously inflated LTV, every model that swore a cohort was gold until it wasn't. So we built Campaignswell to do what we always wished other tools could: make sense, move fast, and keep up with real life. Our predictions don't just look good, they work where it matters.
Ready to see it in action?
Predictions that don't flake. Real metrics that speak up. One dashboard to make them play nice.
Book a demo and we'll show you exactly how it all plays out.

Co-founder & CEO at Campaignswell
Book a demo


Co-founder at Campaignswell
Use the session to ask your hardest questions about scaling, LTV, or attribution, and see how full-funnel predictive analytics gives you clear, actionable answers.

Why your Subscription App can’t break the $100K/Month ceiling without losing revenue


71 takeaways mobile app publishers can use to improve monetization strategy and LTV
10 monetization mistakes that hold back subscription apps