
Campaignswell How-to Guide
The Basics
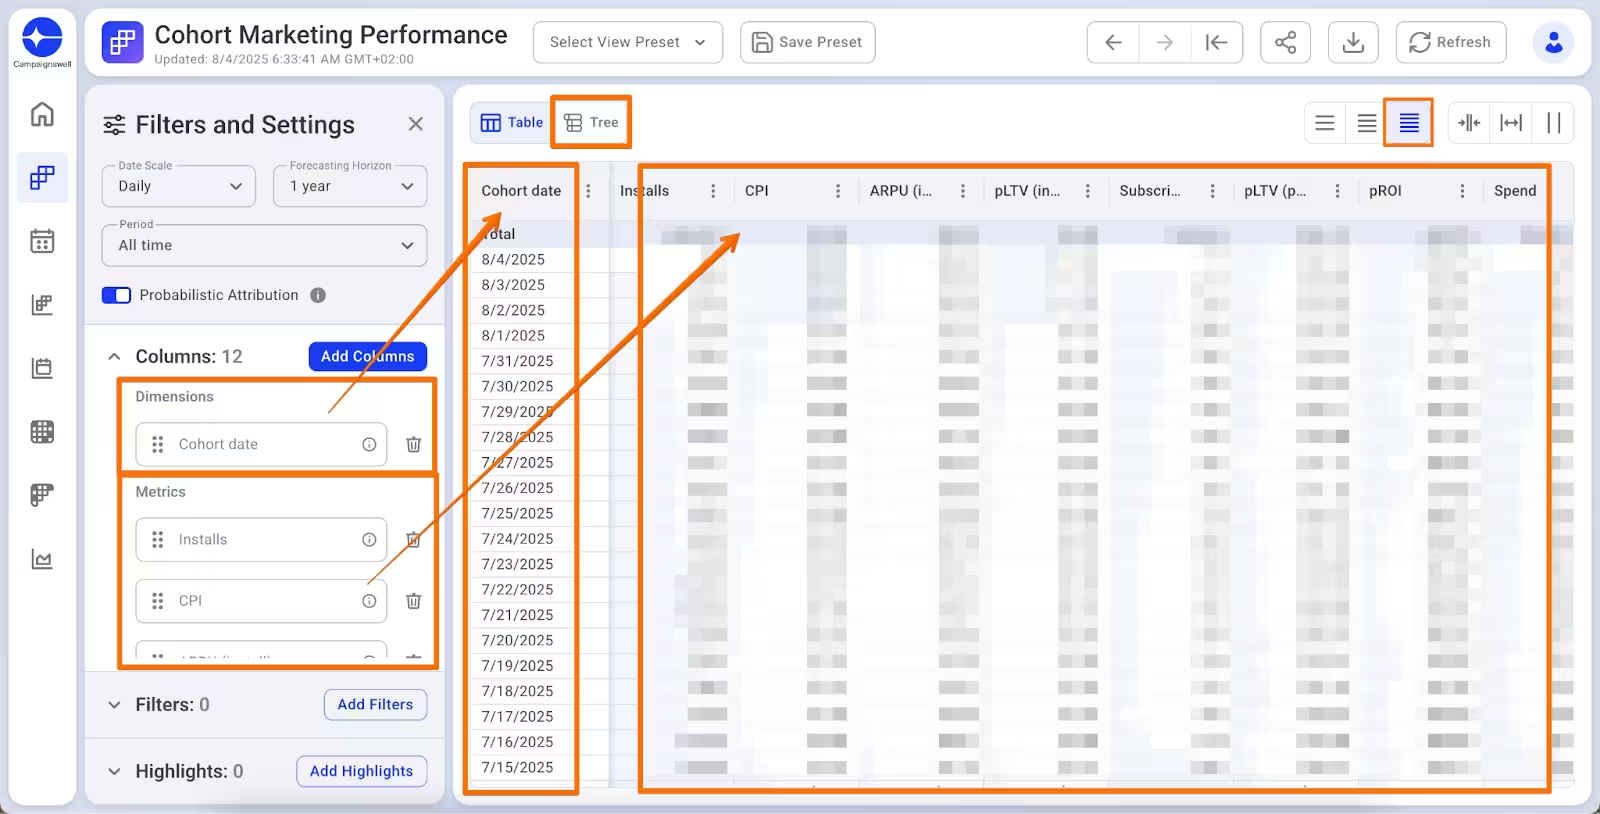
Campaignswell shows you which ad channels bring valuable users and predicts future data from recent cohorts. The dashboard has two parts: left side for grouping users (dimensions), right side for metrics.
Each row = a cohort (group of users). Users are attributed to cohorts by install date (mobile) or first visit date (web). Add dimensions to slice your data, add metrics to measure performance.
Core Workflow
- Add dimensions (left side): Media Source, Campaign, Date, Country, etc.
- Add metrics (right side): Installs, Spend, CPI, Revenue, pLTV (Subscriber)
- Enable Tree View to drill down: Source → Campaign → Date
- Analyze and compare cohorts
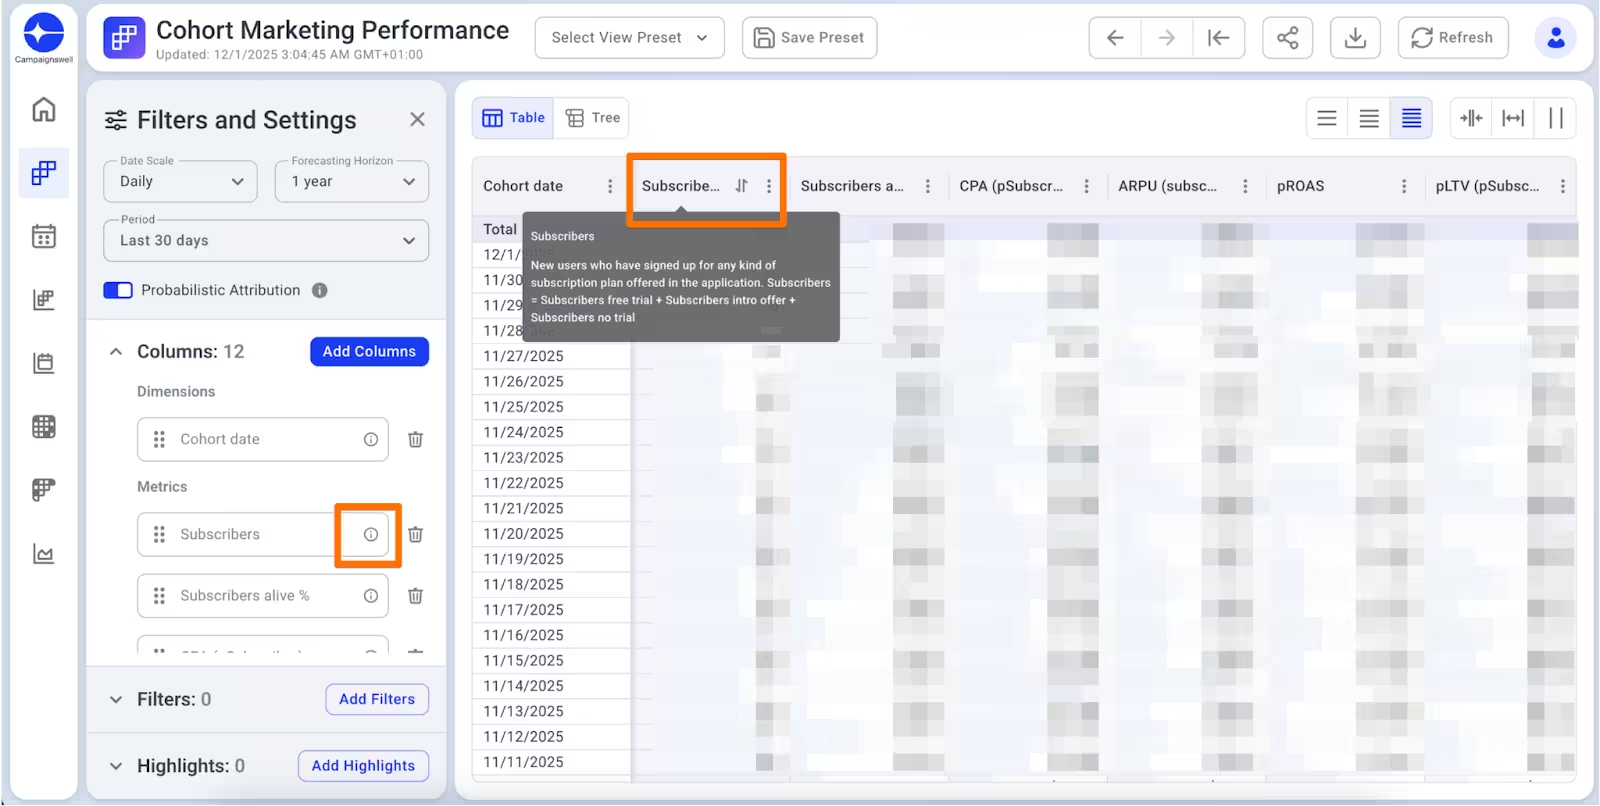
Dimensions VS Metrics
We have 1000+ metrics. Hover over any metric name to see its description and calculation formula.
Key Metric Categories
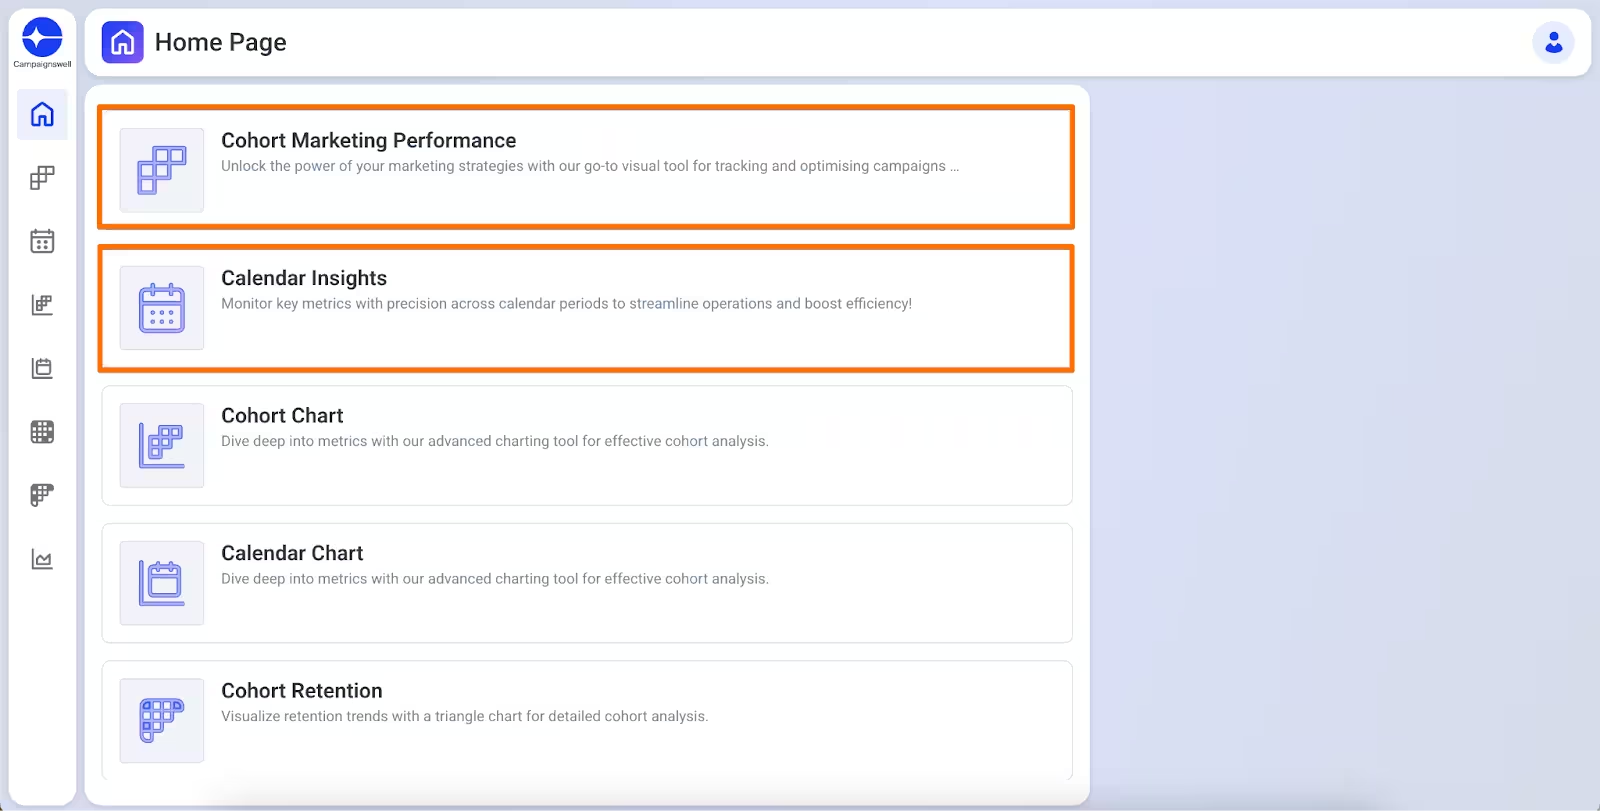
Cohort Marketing Performance VS Calendar Insights
👥 Cohort Marketing Performance - data grouped by when users arrived (install/first visit date).
User installed on July 1, paid on July 15 → revenue shows under July 1 cohort.
🗓️ Calendar Insights - data grouped by when events happened (transaction date).
Same user → revenue shows under July 15.
When to use which:
Example: You spent $10K on July 1. Users pay over the next 90 days.
Cohort: All revenue tied to July 1. You see: spent $10K → got $25K. True ROI.
Calendar: Revenue scattered across 90 days by payment date. Shows cash flow, not campaign performance.
Funnels
A funnel is your onboarding website where users subscribe. In web2app funnels users subscribe in mobile app after the funnel.
Two types of web funnels:
Web2Web — users go through web pages (onboarding → sign up → purchase → access product). Monetization happens on the web via Stripe, PayPal, etc.
Web2App — web pages guide users to install and use the mobile app. Monetization happens in the app via Apple, Google, etc.
Add your funnels prior to launch in Product Catalog → Manage Web Funnel Links in Campaignswell UI for your each app separately.
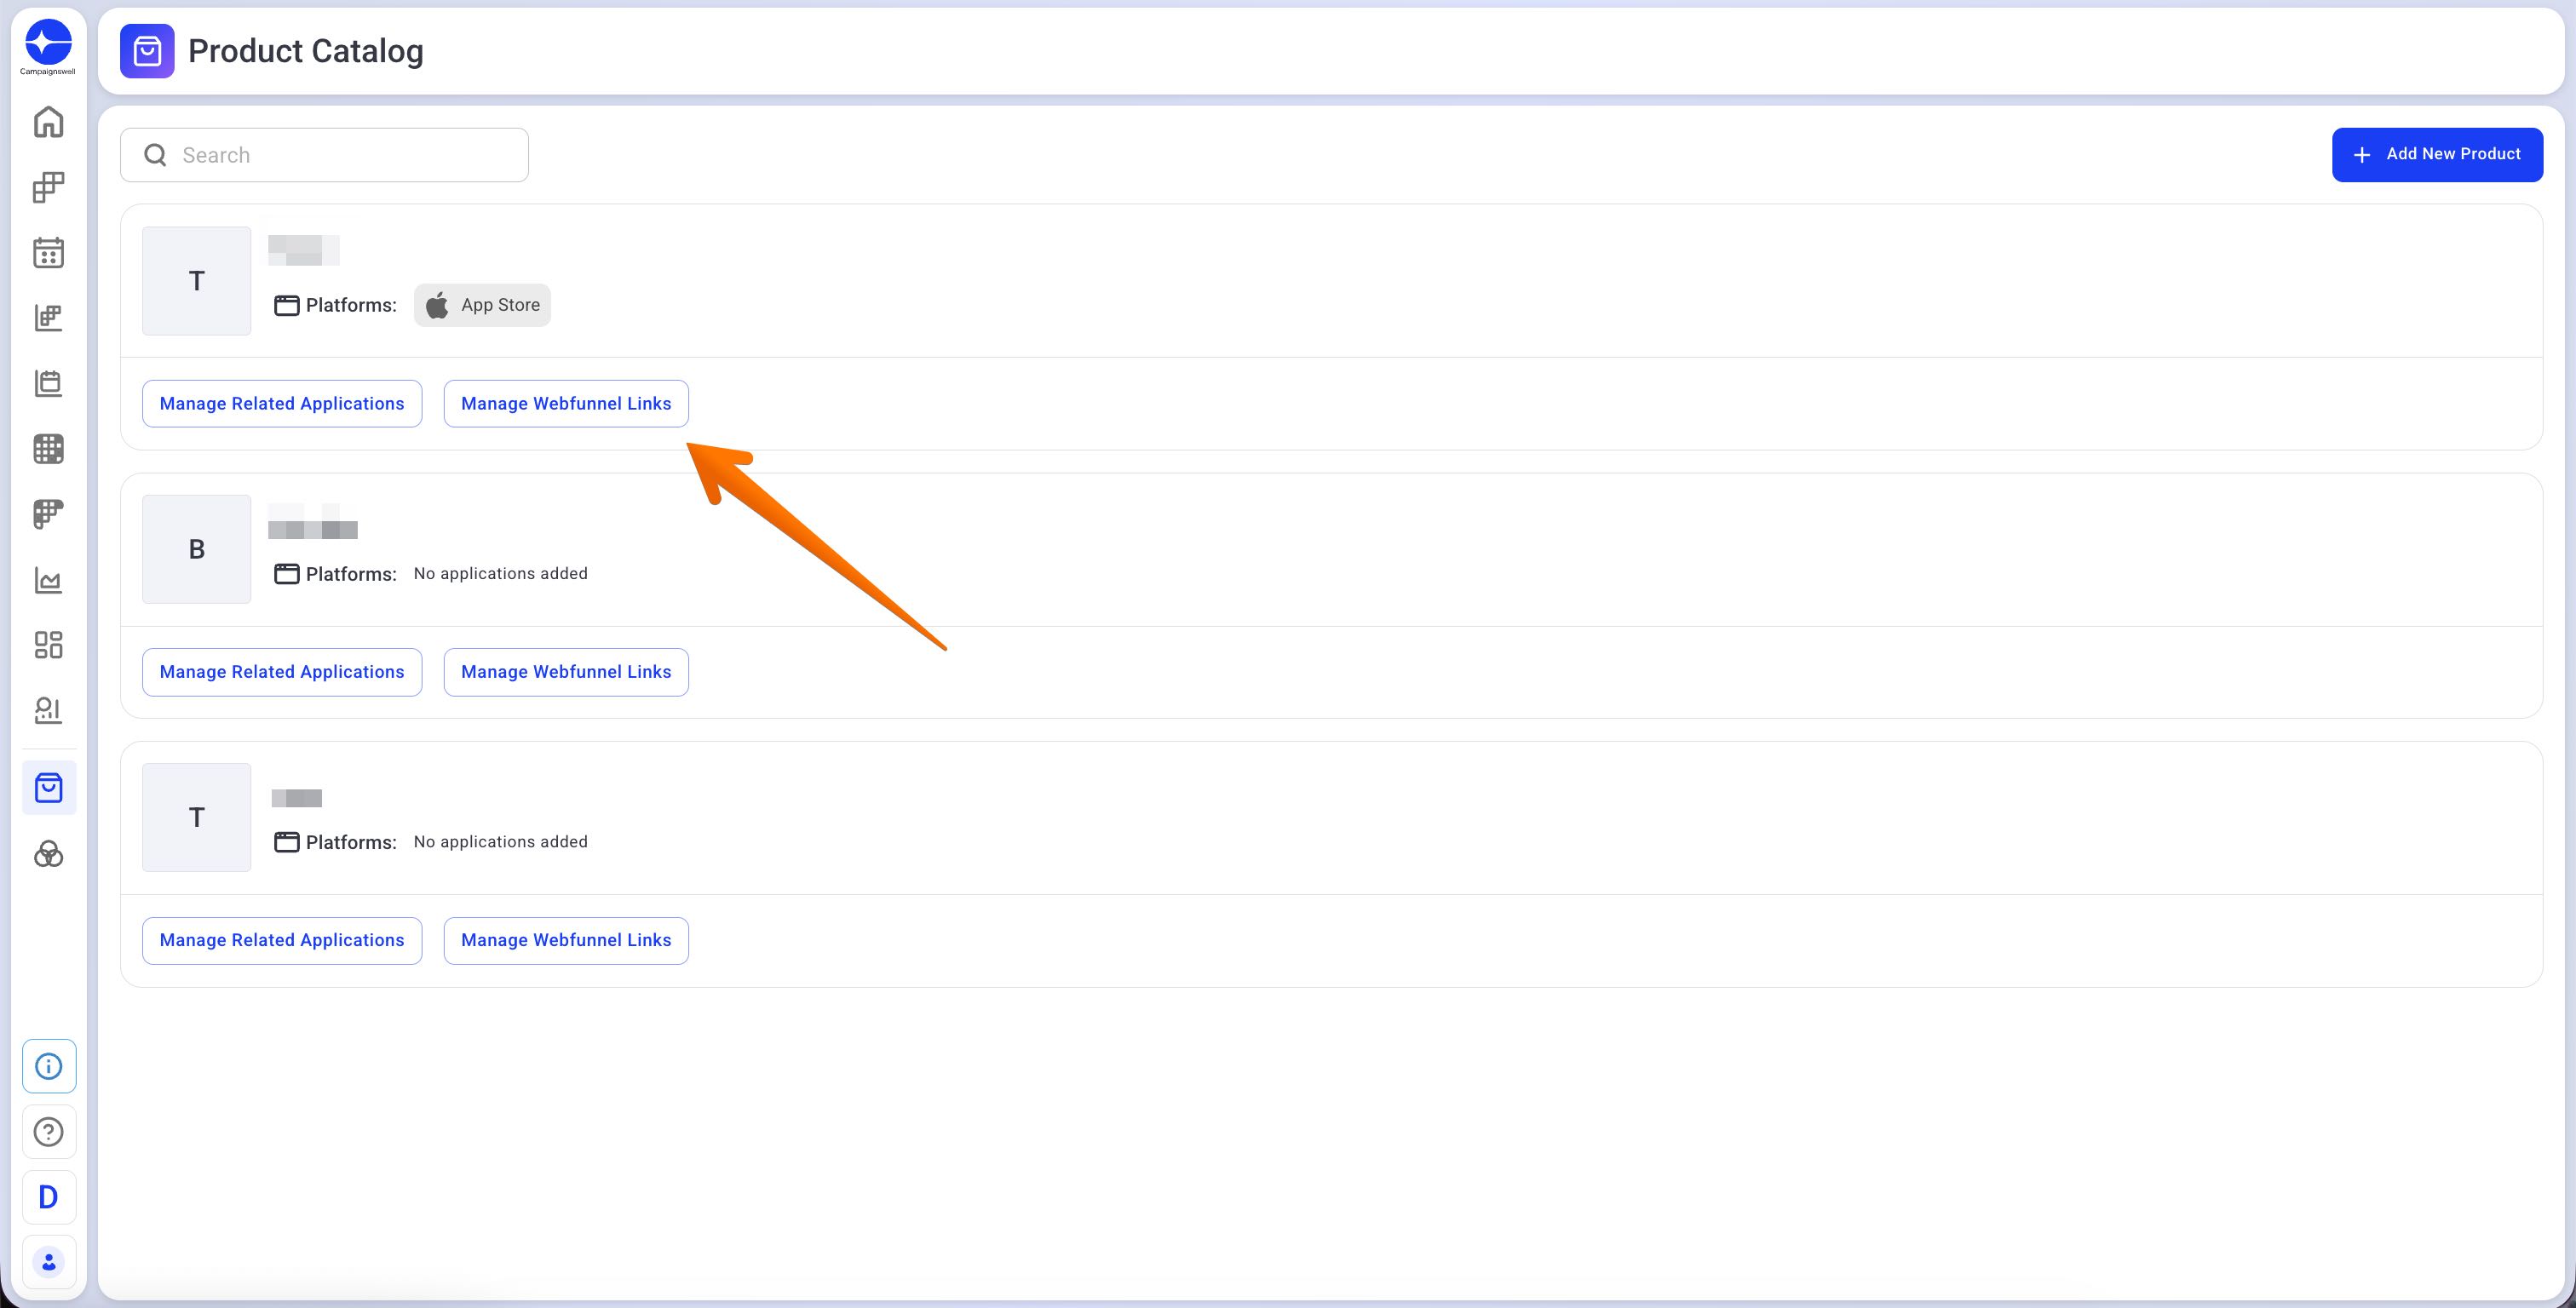
If you add abc.com - all funnels show as one row. If you add abc.com/funnel-1 separately - each funnel gets its own row in UI.
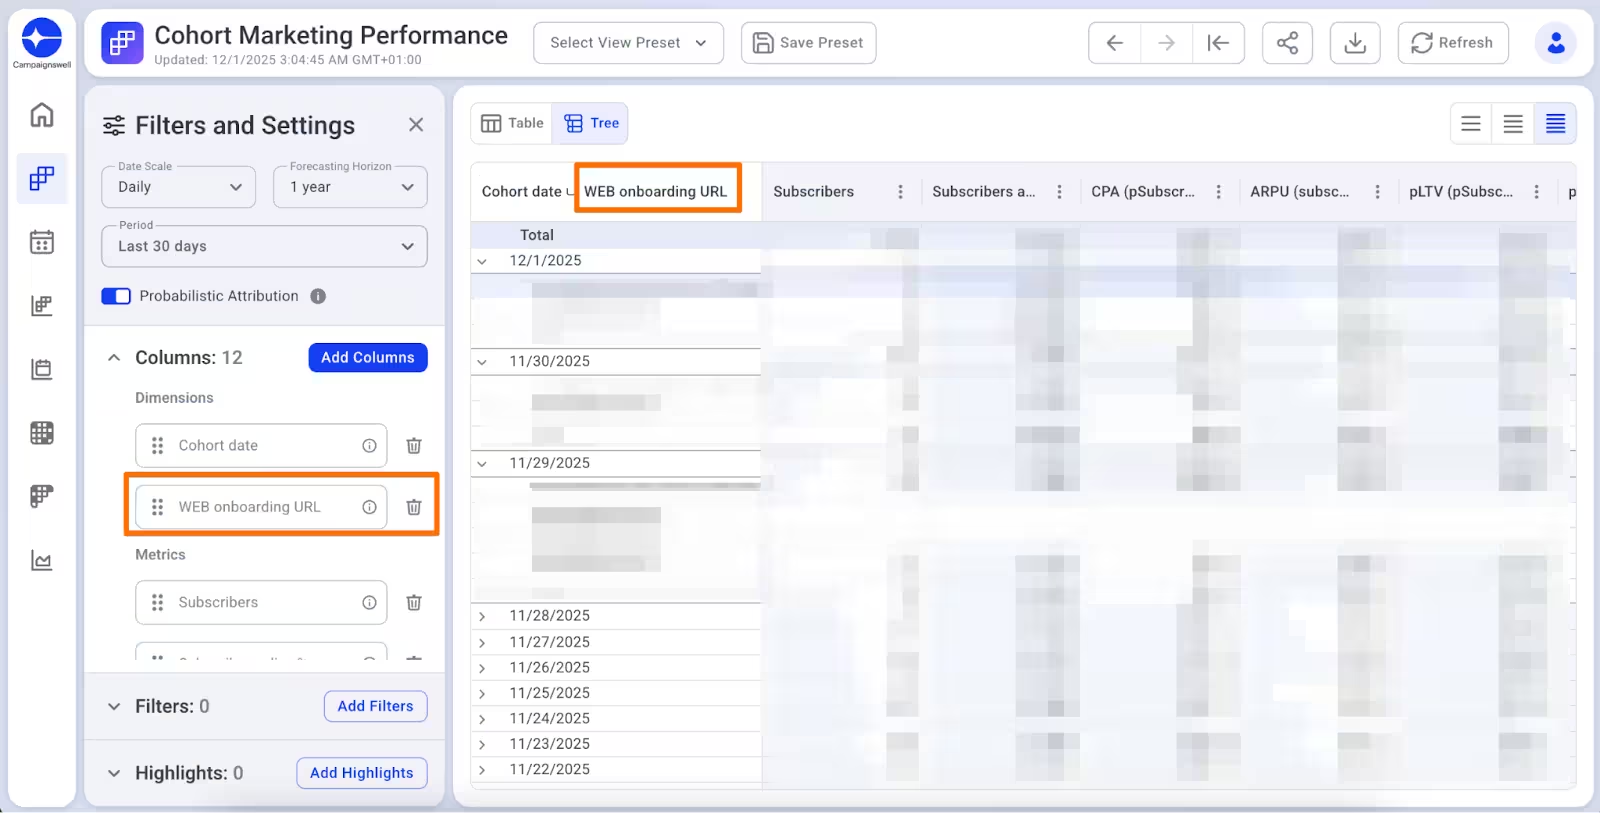
Use "Web Onboarding URL" dimension to split by funnel
Attribution
Web & Android: Deterministic. We link revenue to installs via events.
iOS: Probabilistic (SKAdNetwork). We estimate which campaign drove installs.
Use the Probabilistic Attribution toggle in Filters and Settings to include iOS estimated data in your reports.
Attribution starts working after you connect analytics (Web2Wave, Adjust, AppsFlyer). No events = no attribution. These events can be passed not only from MMP or event analytics systems, it can be subscription management system like RevenueCat.
Predictions
pLTV predicts lifetime value based on early cohort behavior. The model is trained on massive cross-industry data, so it works even if you change your acquisition strategy.
Spend
We pull spend daily. If your ad network updates data retroactively (month-end reconciliation), tell us, we'll refresh it.
Need to add agency fees? Let us know the percentage.
Data Reconciliation
If numbers don't match: check filters, date range, refund dates. Send us CW report link, screenshots & metric you use for comparison in the other system, we'll dig into raw data.
Quick Checklist
🔗 See more about data check here
FAQ
No historical data before integration? Attribution needs events. No events/MMP/subscription mgmt system = no link between funnel and transaction.
Historical spend wrong? Ad networks update retroactively. Tell us the date range to refresh.
Payment system transactions missing? Let us know, we'll investigate.
Need Help?
Share a report link + screenshot, then message us or send a Loom.