Cohort analysis for mobile app growth: actionable insights that drive retention

What is cohort analysis and why it matters for mobile app teams
Cohort analysis is one of those tools that instantly makes you wonder how you ever made decisions without it. Instead of one big pile of data, you slice your users into groups and watch how each behaves over time. Maybe it’s everyone who installed during a TikTok push, or the people who saw Creative B in the U.S., or a segment that hit your new paywall test. Suddenly, performance isn’t blurry anymore, you see which groups actually bring value and which ones just look good on paper.
For mobile app marketers, this lens changes the game. You’re no longer stuck squinting at blended numbers. You can:
- Compare retention rate across campaigns, platforms, or creatives and instantly know which audience deserves more budget. (Hint: it’s rarely the one with the rock-bottom CPI.)
- Map the user journey in detail: install, onboarding, trial, purchase, renewal, and spot where users lose interest faster than they swipe past a bad ad.
- Identify user behavior patterns that separate long-term subscribers from the churn-prone crowd. Think of it as fortune-telling, minus the crystal ball.
Why does this matter? Because big ad budgets evaporate when you’re scaling on guesses. A campaign with a dirt-cheap CPI can still bleed money if the cohort bails before day seven. Meanwhile, a pricier campaign might look scary at first glance but turn out to be your most profitable engine once you track conversion rates and renewals properly.
The magic of cohorts is that they put every decision in context. Instead of chasing surface metrics, you focus on the groups that drive actual profit. In the next section, we’ll break down the core elements — app retention, group users, retention rate, behavioral cohorts, customer experience, conversion rates, product strategy, and churn rate — before showing how Campaignswell turns this framework into a daily decision-making system that gives teams the courage to scale even to $600K a day.

Cohorts in the context of mobile apps
Ask any growth lead what a cohort is, and you’ll probably get a smirk before they dive into examples. In mobile apps, a cohort is just a bunch of users tied together by the same starting point. Think of it as a label on the box you drop them into. Some classic ones:
- Install date: “The Week 23 gang” who all joined during that TikTok push. A week later you already see if they’re still around or ghosted faster than a bad Tinder date.
- Acquisition source: Meta users versus TikTok users. One group might binge your app like Netflix, the other might open once and vanish. Same CPI? Totally different stories.
- Creative: everyone who clicked the cat meme ad versus the sleek product demo. Spoiler: sometimes the silly cat ad pays the bills.
- Product path: users who hit Paywall A versus Paywall B. Or those who grabbed the yearly plan on day one versus the cautious monthly testers.
The fun (and the pain) comes when you track how each of these groups behaves over time. Some cohorts stick, spend, and keep engaging. Others churn so fast you wonder if they even downloaded the right app. This is where patterns appear: which campaigns actually bring retained users, which onboarding steps are killing conversions, and where to push budget with confidence.
Cohorts are like looking at the crowd under a spotlight instead of guessing in the dark. Once you see them clearly, you stop throwing money at traffic that doesn’t stick and start scaling the pockets of users who actually matter.
Core elements of cohort analysis
App retention: the foundation of long-term growth
Retention is the heartbeat of any mobile app. Cohorts let you track exactly how many users stick around after day one, week one, and month one. If your retention curve looks like a ski slope, you know there’s a problem. If it flattens and holds, you’ve found stability. Marketers use this to decide which campaigns bring in loyal users and which campaigns only deliver tourists who never unpack.
Group users: making sense of the chaos
Looking at a million users all at once is like trying to understand a concert by listening to the crowd noise. Grouping users by source, creative, geo, or paywall variation gives you a clear tune to follow. You can see that TikTok users behave differently from Meta users, or that one creative brings in people who actually renew while another just attracts window shoppers. Grouping cohorts is how you go from messy noise to actionable signals.
Retention rate: your real north star
Retention rate is the number that keeps finance calm and UA confident. Cohorts make retention rates visible for each campaign, creative, and test. If a cohort holds strong after week four, you can justify pouring more spend behind it. If it collapses early, you can shut it down before it drains budget. Think of it as early-warning radar for both success and failure.
Behavioral cohorts: patterns that predict the future
Some users install and vanish. Others explore, interact, and pay. Behavioral cohorts track what people actually do and connect those actions to long-term value. Spotting these patterns lets teams predict who’s going to renew and who’s heading for churn. It’s like watching the trailer of a movie and already knowing if it’s worth buying a ticket.
Customer experience: beyond the numbers
Behind every chart is a real user experience. Cohorts highlight how product changes, like a redesigned onboarding flow or new pricing plan, impact actual behavior. If churn drops after a change, the cohort view confirms it. If retention tanks, you know the change backfired. This link between marketing and customer experience keeps teams aligned on what really matters: making users happy enough to stay.
Conversion rates: the reality check
High install numbers don’t mean much if conversion rates lag. Cohorts expose conversion step by step, from first session to first purchase to renewal. A cohort with average retention might still outperform if conversion rates are strong. It’s a reminder that scale without conversion is just expensive window dressing.
Product strategy: guided by cohorts
Cohort analysis shapes product roadmaps. If one paywall variant consistently delivers higher LTV, that’s a product decision, not just a marketing win. Teams use cohorts to decide what to build next, which features to retire, and where to focus engineering effort. It makes product strategy less about gut feeling and more about hard evidence.
Churn rate: the silent killer
Every marketer knows churn hurts, but cohorts show exactly where it happens. Maybe trial users bail at day three, or annual subscribers don’t renew after month twelve. Churn rate at the cohort level gives you precision. Once you know where the leaks are, you can patch them through lifecycle messaging, creative refreshes, or onboarding tweaks. Cohorts turn churn from a mystery into a fixable problem.
How cohort analysis works in Campaignswell
So what makes Campaignswell your superpower in cohort analysis? Imagine taking all the theory — retention curves, churn charts, conversion funnels — and giving it caffeine, attitude, and predictive brains. That’s what Campaignswell does. It’s a SaaS BI platform built by marketers and data scientists who got sick of juggling five dashboards and fighting over whose spreadsheet was “more correct.” Campaignswell gives you one clean view of your cohorts, how they behave, what they’re likely to do next, and how much revenue they’ll bring in. And here’s the kicker: the teams already using Campaignswell say they finally feel safe pushing the gas pedal on scale. That confidence shows up in the numbers: they have grown spend and revenue by 10x or more within their first six months on the platform.
Here’s how it feels when you actually use it:
Day‑zero predictions. Instead of staring at a fresh campaign and saying “let’s wait a month to see if it works,” you get forecasts from day one. CW looks at early hints (sessions, trial starts, first purchases) and projects the whole retention curve. It’s like having a spoiler alert for your own campaigns.
Easy grouping without the Excel acrobatics. Want to slice users by creative, geo, or paywall? Go ahead. Campaignswell does the sorting so you don’t have to drown in CSVs. It’s grouping cohorts the way Spotify makes playlists: quick, painless, and surprisingly satisfying.
Revenue in plain sight. Lots of tools will tell you how users behave. CW goes straight to the point: how much money are they going to generate. Every cohort shows predicted ROI and payback windows, so you know which ones deserve champagne and which ones need a quiet funeral.
One scoreboard for everyone. UA, product, and finance all see the same numbers. Which means fewer “my dashboard says X” arguments and more “okay, let’s scale this” decisions. Less drama, more action.
Scaling without panic attacks. This is the big one. Once you can trust cohort forecasts, scaling stops feeling like you’re betting your house in Vegas. Clients have gone from $50K a month to six‑figure daily spend without wrecking ROI, because they could finally see what was coming.
That’s Campaignswell in the context of cohort analysis: a tool that turns messy data into clear, predictive stories your whole team can act on. Less waiting, less guessing, and way more confidence to push spend where it actually pays back.
Case studies & scenarios
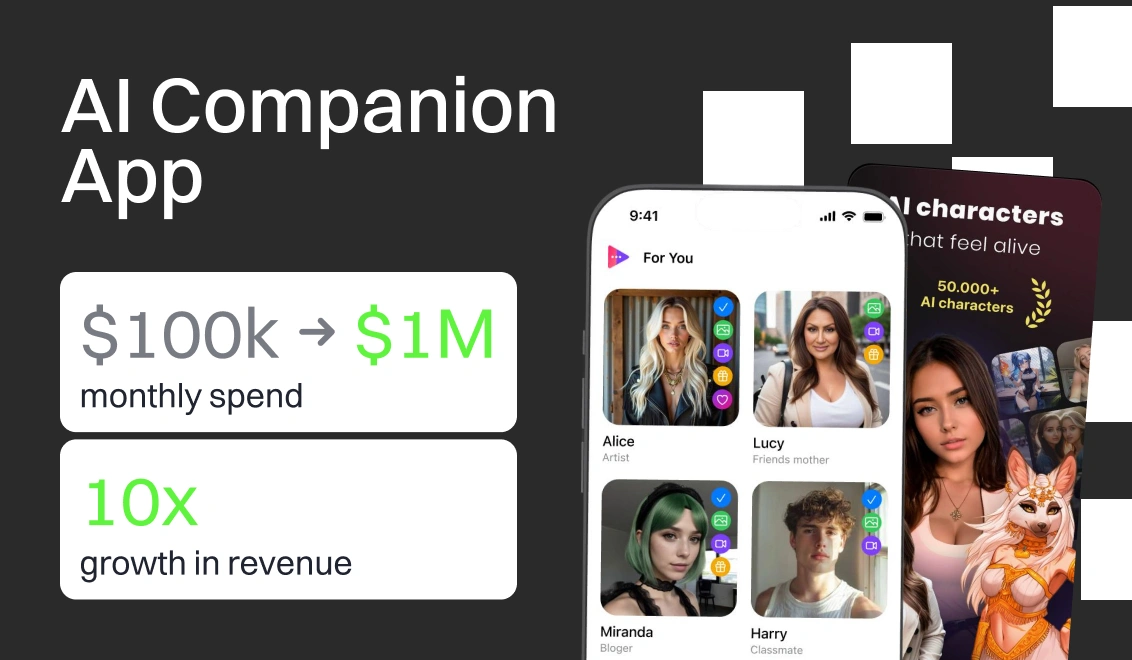
AI Companion app: scaling 10× without losing sleep
An AI companion app team was running lean: a handful of campaigns, rising anxiety about scaling, and constant headaches from spreadsheets and lagging dashboards. Tired of the guessing game, they went looking for something faster and sharper. At one point, they faced the classic choice: spend months building a custom BI tool with analysts and engineers, or grab a SaaS BI that actually worked out of the box. They picked Campaignswell. Within days they had predictive cohort dashboards showing retention and revenue forecasts. No waiting a month to see if campaigns worked, by day two they knew which cohorts would pay back. That clarity gave them the courage to scale hard. Six months later, both spend and revenue had exploded more than 10×.
Know more
AIstats: from side project to $150K MRR
AIstats started life as a small analytics project scraping by at around $5K MRR. Hiring a BI team wasn’t even on the table. Instead, they plugged Campaignswell in and suddenly had enterprise-grade dashboards without writing a line of SQL. Cohort analysis stitched ad and subscription data together, predicted revenue trajectories, and gave them the confidence to grow. A year later they weren’t a side project anymore—they were pulling in $150K MRR and still hadn’t hired a single analyst.
Read the full case study
Web-to-App funnel: 20% revenue from a hidden path
One client stumbled on a surprise: users who came through a web-to-app flow were worth far more than anyone expected. Most teams would have missed it, but Campaignswell’s cohort tracking flagged the pattern early. The cohort view showed these users had strong retention and payback, so the team doubled down. That “hidden” funnel is now driving 20% of total revenue.
Check out the full case study
Multi-vertical mobile app studio: tripling spend with predictive LTV
This multi-vertical mobile app studio hovered around $50K monthly spend and hesitated to scale. Every push felt like a gamble. Once they saw Campaignswell’s day-zero cohort forecasts, hesitation disappeared. They could finally see which campaigns would make money before the revenue even showed up in the bank account. With that kind of foresight, the team tripled spend to $165K/month while keeping ROI healthy.
Dive into the full case study
Lumos VPN: Android scaling and ROI lift
Lumos VPN had growth but no profit lift — the classic “lots of installs, flat ROI” story. Cohort analysis inside Campaignswell revealed where payback windows were shorter and which creatives were actually making money. Armed with that clarity, the team doubled down on Android campaigns, cut payback time in half, and lifted ROI by 50%. For the first time, growth came with profit attached.
Take a look at the full case study
[[cta1]]
Deeper understanding: the predictive power of cohorts
Cohort analysis gets really interesting when you go beyond surface metrics. Campaignswell isn’t just showing retention curves but helps teams dig into the details of user behavior and pull out the insights that actually change how you run campaigns and build product.
Here’s what “deeper understanding” looks like in practice:
- Spotting false signals in active users. A bump in monthly active users might look good in a report, but cohorts often reveal that many of those users vanish after a single session. Campaignswell highlights which cohorts actually stick, so you know if growth is real or just noise.
- Finding patterns in feature usage. One client learned that cohorts using a specific feature in their first week were twice as likely to renew. That insight only appeared once the team looked at behavior by cohort, not in blended dashboards.
- Mapping where users drop. Instead of guessing why retention is down, cohorts pinpoint the step in the user journey where people leave. Maybe they churn right after the paywall, maybe during onboarding. Either way, you get a clear target for improvements.
- Understanding how different cohorts react to changes. Roll out a new paywall or onboarding flow, and Campaignswell shows immediately how cohorts exposed to it behave versus the old version. That’s a deeper lens than just looking at “average retention.”
- Turning insights into actions. With predictive dashboards, you don’t just see what went wrong, you know which fixes will pay back. That’s where actionable insights meet targeted improvements.
Deeper understanding is what turns cohort analysis from an academic exercise into a daily growth engine. By segmenting users in ways that matter, you stop guessing and start seeing exactly which levers drive revenue.

Actionable insights that unlock real growth
Cohort analysis becomes most valuable when it’s tied directly to user behavior data, user engagement, and real business outcomes. By looking at user interactions, user sessions, and user flows in context, teams gain a much deeper understanding of what drives retention, conversions, and revenue. Here are a few clear examples:
Scenario 1: Creative clarity that reduces risk
A UA manager is running two marketing campaigns with nearly identical CPIs. At first glance, there’s no way to tell which campaign deserves more budget. Cohorts expose the difference quickly. By checking early signals, like session depth, trial starts, repeat opens, it turns out that users from one creative have a much higher chance of becoming retained users. That single insight changes the budget call midweek and prevents thousands of dollars from going to the wrong place.
Scenario 2: Onboarding fix that cuts churn
The product team ships a new onboarding flow. Installs tick upward, but user retention feels soft. Cohorts break the story down. One group of app users exposed to the new flow shows a sharp drop at the paywall. Another group, still seeing the old flow, holds steady. That contrast points straight to the problem. A quick change in the onboarding script plugs the leak, and the next cohorts confirm retention is back on track. This is how targeted improvements turn into measurable results.
Scenario 3: Finance gains confidence
Finance teams are often cautious, worried about overspending before revenue catches up. Cohort analysis gives them visibility into when different groups of users actually pay back. With accurate forecasts for churn rate, conversion rates, and expected ROI, finance sees when cash returns to the system. That clarity speeds up approvals, aligns with data-driven decisions, and lets UA teams scale faster.
Scenario 4: Geo segmentation reveals hidden value
Traffic from one region looks expensive at first glance. CPI is high, and the instinct is to cut spend. Cohorts tell a different story. Users from that geo show stronger user engagement and higher lifetime value. What looked like overpriced traffic turns out to be the most profitable audience once you follow the group users view over time.
Scenario 5: Feature adoption signals long-term retention
A product team launches a new feature and needs to know if it actually matters. Cohort tracking shows that users who try the feature usage in their first 48 hours are twice as likely to still be active a month later. That signal convinces the team to adjust the user journey and make the feature part of onboarding, boosting long-term retention.
These stories highlight what makes cohorts powerful: they uncover patterns hidden by averages, provide a deeper understanding of app retention, and turn raw data into actionable insights for scaling.
Cohort analysis as the growth engine for mobile apps
Think of cohorts as switching on a spotlight. All at once, the crowd of installs splits into clear groups: those who stick with your app and those who vanish after a single try. Instead of squinting at averages, you get a sharp picture of who’s worth keeping and who was never really in the game. When you follow groups of users over time, the story gets clearer: what actually drives growth, where churn sneaks in, and which experiments are worth scaling.
The magic is that everyone wins. UA stops gambling budgets, product fixes what really hurts the journey, and finance finally sees numbers they can believe. Instead of fighting over spreadsheets, the team starts pulling in the same direction, and growth feels a whole lot less scary.
If you want to see how this works in practice, book a demo with Campaignswell's founders. They’ll show you how cohorts can turn your data chaos into clarity and give you the confidence to scale without losing sleep.
Want to see what insights cohort analysis gives for budget decisions?

Co-founder & CEO at Campaignswell
Book a demo


Co-founder at Campaignswell
Use the session to ask your hardest questions about scaling, LTV, or attribution, and see how full-funnel predictive analytics gives you clear, actionable answers.


Why your Subscription App can’t break the $100K/Month ceiling without losing revenue


71 takeaways mobile app publishers can use to improve monetization strategy and LTV

10 monetization mistakes that hold back subscription apps