How Campaignswell predicts LTV and helps teams scale to $600K/Day without killing ROI

For anyone tired of spending big with crossed fingers
You know that moment when your UA team says, “this campaign is on fire,” the product team says, “we changed the onboarding last week,” and finance is quietly emailing, asking where last month’s revenue actually came from? Yeah. That moment.
That’s the moment most growth teams live in, more often than they’d like to admit.
Not because they’re disorganized or don’t have enough tools. Because those tools don’t talk to each other, and when they do, they say completely different things.
You’ve got a Meta dashboard showing one thing, TikTok telling a different story, Amplitude breaking out event funnels, Appsflyer arguing with SKAN, and a spreadsheet that only one person on the team knows how to update properly. Meanwhile, you're spending tens or hundreds of thousands per month and trying to hit targets.
You want to optimize payback, to scale what works, to stop wasting money, but no one can quite agree on what’s actually working. So the team just... guesses. Smart guesses, but guesses.
We’ve been in that room. That’s why we built Campaignswell.

Meet the “dashboard” that predicts ROI and won’t ghost you after Day 7
We’ve seen teams running six-figure campaigns with more tooling than a NASA mission. Beautiful dashboards, airtable trackers, spreadsheets with tabs labeled “DON’T TOUCH.” But ask five people on the team what’s actually working, and you’ll get six answers and one nervous laugh. These teams are full of smart people doing their jobs well, but without a single source of truth showing where value’s actually being created, everyone ends up optimizing their own corner of the cockpit.
That’s why we built Campaignswell: to merge all your critical sources into one real-time view. Over 100 integrations across ads, attribution, billing, and product behavior. Campaignswell gives you true cross-platform ad tracking, tying together Meta, TikTok, Appsflyer, SKAN, Stripe, RevenueCat, Amplitude, and more into one clear picture. You get one interface that shows what’s happening now and what’s likely next, so you can make budget decisions with full clarity.
One team used it to triple Android spend without breaking a sweat by connecting predicted ROI with actuals, spotting which campaigns and partners were scaling profitably, and cutting the ones that weren’t. Over six months, ROI grew from 14% to 50%.
Another spotted a sleeper funnel test early and turned it into 20% of total revenue.
A third scaled to $600K/day with pROAS signals updating every morning.
No, we’re not alchemists. We’re a team of data people who just finally built the thing we wished existed when we were the ones chasing numbers across ten tabs.
Let’s show you how it works, and you’ll see if this is the kind of clarity your team’s been missing.
.png)
How Campaignswell does LTV forecasting (finally, numbers you don’t have to side-eye)
Every ad platform tells a different story. Meta is thrilled with Creative A. TikTok’s not impressed. SKAN is throwing riddles. Stripe and RevenueCat are just sitting there in silence, waiting for someone to decode the chaos.
Campaignswell clears the fog by watching what actually matters, how real users behave after the click. Technically speaking, Campaignswell connects your core stack: Meta, TikTok, Google Ads, SKAN, Appsflyer, RevenueCat, Stripe, Amplitude, etc. Then it does what no spreadsheet or stitched dashboard can: it builds and constantly updates a live mathematical model of how your users behave and how that behavior turns into money.
It gives you the kind of insight teams usually try to get from custom BI, but without the months-long build, the team of data engineers, or the six-figure price tag. It ingests behavioral signals across user cohorts: how they subscribe, churn, downgrade, stick, and how all of that compares to patterns we’ve already seen in hundreds of apps. It finds the commonalities, the anomalies, and the monetization signatures. It’s trained to learn, and it learns fast.
You get actual and forecasted payback windows, ROAS, LTV, ROI by geo, campaign, creative, and audience segment. Automatically refreshed every day, as new user behavior comes in and the model adjusts to reflect the latest patterns.
You launch a campaign, and by day one, Campaignswell is already estimating how much that traffic is likely to earn in the coming weeks. It’s been trained on user behavior like this, at price points like yours, converting through flows that look eerily familiar. The patterns are clear, the logic is sound, and the signal shows up while it still matters.
Campaignswell was built by a team with deep roots in applied mathematics, data science, and large-scale analytics from fintech platforms and deep tech products to mobile app ecosystems. They’ve spent years turning noisy user behavior into accurate, actionable forecasts, and built this system because they were tired of seeing smart teams slowed down by vague dashboards and fragmented data.
And if you’re wondering what that actually gives you in practice, think less dashboard chaos, more answers to the questions that usually take a war room and five analysts to untangle. Like: is creative D driving real revenue or just spiking day-one installs? Is that web-to-app flow actually worth the CAC? What’s the true payback window for campaign 43 in LATAM?
That’s the kind of clarity Campaignswell puts in front of you.
You get all of this in one place, live, and ready to use without waiting weeks for the data team, without spending months building internal BI pipelines, and without realizing too late that the campaign you paused was your actual growth lever.

How teams use Campaignswell
Campaignswell doesn’t ask teams to reinvent their process. It fits into the way they already operate and suddenly, everyone’s on the same page and seeing the same signal.
User acquisition teams open it daily to track how cohorts are evolving, whether campaigns are heading toward payback, and which creatives are actually generating revenue. Bid strategies that used to sit untouched for weeks now get adjusted mid-flight, backed by ROI forecasts instead of gut checks.
Finance teams use Campaignswell to build weekly reports, model CAC payback, and segment spend across channels. What used to take exports from three different platforms now happens in one tab. They see cashflow projections, know where spend is headed, and stop relying on out-of-sync numbers from MMPs, Stripe, and BI dashboards.
Product managers and analysts use it to finally connect product performance with marketing outcomes. They test paywall variants and onboarding flows, track how different experiences affect retention, and measure downstream monetization. Creative-level performance meets behavioral segmentation, all without having to ask five different people for the data.
And while UA and product teams are deep in daily metrics, CEOs and CMOs use 12-month LTV to zoom out: understand where the business is really headed, how fast they can afford to move, and what bets are actually worth making. It’s the kind of clarity that makes bold growth feel like a calculated move and lets them sleep knowing Month 9 won’t come back to bite.
Everyone from paid media to product to finance still works the way they always have. They just stop arguing over who has the “real” numbers and start using the same live forecasts to make better decisions, faster.

What changes when LTV forecasting stops being theoretical
The first shift most teams notice is how quickly uncertainty fades. The endless debates, cautious pacing, and half-hearted tests give way to clear decisions and fast moves. And once the forecasts start matching real revenue, the second shift kicks in: growth picks up speed, not as a gamble, but as a planned next step that everyone’s already aligned on.
We’ve seen teams move from small experiments to full-scale campaigns in a matter of weeks, not because someone got overly confident, but because the platform showed strong early indicators: campaign-level ROI, payback trajectory, and LTV forecasts that held up in reality.
One team used early cohort forecasts to shape a web-to-app funnel test, and six months later that single experiment was driving 20% of total revenue.
Another team ramped up spend 3x and took ROI from 7% to 50% in just six months. Payback time across the company shrank from half a year to just three months.
And then there’s the team reallocating budget daily with full control, scaling to $600K/ a day in ad spend without panicking, and more importantly, without watching ROI fall off a cliff.
Turns out, when your forecasts actually reflect user behavior, $600K a day doesn’t require nerves of steel just a calendar and a working coffee machine.
.png)
Wait, does this mean we can skip the BI stack?
At this point, you’ve probably realized Campaignswell isn’t just another place to stare at yesterday’s numbers. It’s what you wish your dashboards were doing already if you had five more analysts, three extra data engineers, and unlimited patience for spreadsheets.
We’ve seen the usual setups. Manual cohort models in Google Sheets, duct-taped together by one person who understands how all the tabs work. In-house BI stacks that take months to build, break when you add a new channel, and need a translator to explain what “ROI by segment adjusted for delay” actually means. They work until you need to move fast, test something new, or get everyone aligned in real time.
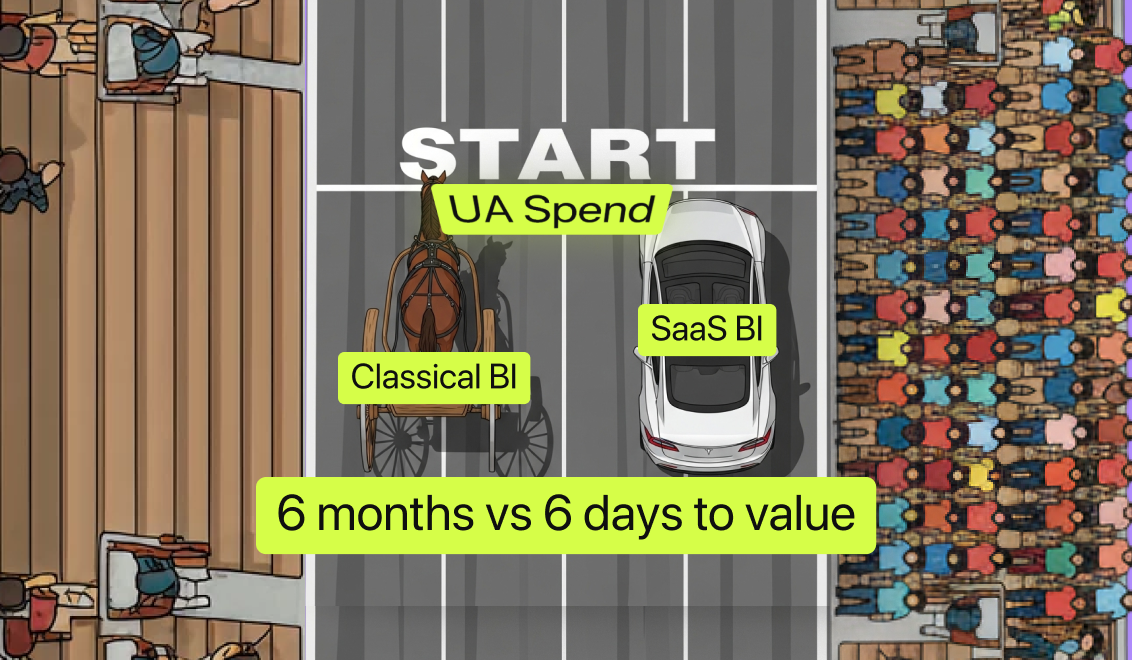
Campaignswell skips the middle step. It connects directly to your sources, builds a live model of cohort behavior, and gives you forecasts that are built to drive action, not just explain what already happened. You don’t have to rebuild the model every time a new campaign goes live, wait two weeks to spot trends, or file tickets just to get clarity. Instead, you get a forecast that updates daily as user behavior evolves, showing exactly what’s working and what deserves more spend.
When growth gets serious, waiting days for clarity starts feeling like a luxury you can’t afford. Campaignswell keeps up, so you don’t have to slow down.

Meet the brains behind the model
Campaignswell didn’t come from a hackathon, an investor brief, or a brainstorm about “the future of dashboards.” It was built by three co-founders with deep roots in applied mathematics, fintech, and mobile analytics, people who had spent years modeling complex systems, and saw firsthand how much marketing decisions still relied on gut instinct, spreadsheet gymnastics, and blind faith in last week’s report.
They knew growth teams didn’t need another layer of charts; they needed clarity they could act on, precision they could trust, and signal strong enough to guide real decisions (without needing a full-stack data priesthood to interpret it).
So they brought in a small group of data scientists and machine learning engineers to make it happen. The outcome is a model trained on behavior from tens of thousands of real users across real products, continuously refined to recognize meaningful patterns and surface predictions you can actually use. It’s math doing what math does best, quietly running in the background, while you finally get to focus on growing the business.
Curious what Campaignswell could unlock for you?
The founders still run the demos. Not because they have to, but because watching teams light up when the numbers finally click never gets old.
Grab a demo slot.

Co-founder & CEO at Campaignswell


