Google sheets vs BI tools: why predictive ROI and LTV modeling matter when you scale UA spend

Ask any performance marketer how their UA reporting started, and chances are it involved Google Sheets. It makes sense. When your ad spend is still in the five-figure range, spreadsheets feel like the fastest way to stay in control. You’ve got direct access to the numbers, can plug in your own logic, track LTV, blend in MMP data, and maybe even model some ROAS projections. No dev tickets and BI team. Just your brain, some formulas, and a sheet that mostly works.
But scale has a way of testing every system.
The moment budgets stretch past $100K/month, cracks appear. One channel’s in Euros, another’s in USD. Facebook reports in Pacific Time, Apple revenue comes in UTC. Your LTV curves shift by cohort, your CAC jumps on weekends, and your spreadsheet starts to lag — literally and metaphorically.
At that point, you can keep using spreadsheets, but the real question is what that decision is costing you. Inaccuracy starts creeping in. Updates take longer. And the bigger your spend, the more it hurts to miss a chance to scale what’s working or cut what’s not.
In this post, we’ll walk through the tipping points: when spreadsheets start breaking, what predictive UA tools do differently, and how your data stack needs to evolve if your team is serious about campaign ROI analysis and scaling ad spend with confidence.

The early days: why spreadsheets work until your data sources multiply
Spreadsheets punch above their weight, especially in the early stages of UA. They let you move fast. You can plug in install data, layer in revenue from Stripe or the App Store, and build out basic LTV or ROAS models without waiting on anyone. For lean teams managing ~$50K/month in spend, this kind of setup feels just right: you see what’s happening, you can forecast a bit, and you don’t need to justify a new tool to your CFO.
They’re also incredibly adaptable. Want to test a new attribution window? Just tweak a formula. Need to merge performance data from TikTok and Meta? Add a new tab and link your sources. As long as the volume’s manageable, you can get a surprisingly solid view of campaign ROI analysis and CAC with just Google Sheets, an MMP export, and a few late nights.
That flexibility is exactly what makes spreadsheets such a go-to for early-stage growth teams.
But the more complexity you layer on, the more brittle it becomes. What used to be a 10-minute check-in turns into an hour of cross-referencing and fixing errors. The formulas that used to give you confidence now feel like guesswork. And without realizing it, you’re optimizing today’s budget based on lagging data from last week.
Up next, we’ll look at exactly what breaks when you try to scale this setup and what that means for your decision-making speed, accuracy, and ROI.
Where it breaks: manual analytics can’t deliver predictive ROI or reliable life time value
As your UA operation scales, the spreadsheet that once gave you clarity starts working against you.
The first cracks usually show up in the data plumbing. One ad account tracks spend in euros, another in dollars. Revenue from Apple is reported in local currencies. You’re running campaigns across multiple time zones — Pacific Time for Meta, CET for TikTok, UTC for your MMP. None of it lines up. So now your CAC, trial-to-subscription rate, or ROAS by cohort? All over the place.
If that wasn’t messy enough, there’s also tax logic. Everyone talks about the 30% Apple fee. But that’s not the full picture. “In Germany, Apple takes 42%,” as one of the founders Campaignswell put it. “Only 30% goes to Apple. The rest is country-level VAT, but most teams don’t track it.” So your LTV numbers look healthy until you realize you’re basing projections on gross, not net.
Then there’s refund logic. Churn. Upgrades. Time delays in revenue reporting. Want to forecast predicted LTV accurately? You’ll need to normalize for subscription plans, fee structures, geo behavior, renewal lag, trial conversion variance, and stitch it to every ad campaign.
“Trying to normalize all this in spreadsheets makes accurate LTV modeling nearly impossible,” says Artem Kazimirchuk, co-founder of Campaignswell. And he would know—he’s had more late nights ruined by broken Google Sheets than he cares to admit. Time zones that don’t match, Apple’s not-so-magical 42% cut in Germany, formulas that quietly double your events until CAC looks fantastic… and then collapses. After enough of those nights, the conclusion was obvious: nobody building serious UA should have to fight their own spreadsheets. That’s why Campaignswell exists: so the next time you scale spend, you’re guided by predictive clarity.
And here’s the kicker: that’s the big stuff. The everyday mistakes are just as painful. Even small errors can trigger a cascade of wrong signals, whether it’s a row out of place, an old currency rate, or a duplicated event.
“You think CAC looks great, so you scale,” as our team likes to say. “But then it turns out the events were duplicated. Now you’re flying blind at 3x the spend.”
And the impact goes way beyond messy data. When decisions are delayed, performance suffers. You’re spending serious budget every day, yet working with outdated signals. Spotting a problem three days late means you’ve already paid for it.
When you’re spending $100K or more a month, delays even more hurt. If you spot an underperforming campaign 72 hours too late, that’s not a learning — it’s a loss. But when your analytics setup is built on manual spreadsheets, you’re always behind the curve. What you see is what already happened. What you need is a system that shows what’s likely to happen next: with predictive ROI that helps you decide whether to scale ad spend or cut it fast.
Next, let’s look at the other route teams often take: building an internal BI stack. It sounds like a solution, but often introduces a different set of problems.

In-house BI systems: expensive, slow, and a tough fit for UA growth
When spreadsheets start breaking down, many teams take the obvious next step: build a proper BI stack. Get everything piped into Looker or Tableau, spin up dashboards, add a few analysts, and finally get those long-awaited cohort views.
It sounds like a solution until the realities hit.
First, <highlight-pink>the cost<highlight-pink>. A proper in-house BI system takes months to build and often runs into seven figures. You’ll need a data engineer to manage pipelines, an analyst to translate business logic, someone to clean and model the data, and a project manager just to keep the pieces moving. And that’s before you’ve shipped a single dashboard.
Then comes <highlight-pink>the delay<highlight-pink>. Even with a team in place, updates move slowly. You spot something off in CAC? Add a ticket. Need a new creative-level ROAS breakdown? That’ll get prioritized after finance finishes their backlog. What started as a fix for slow insights just becomes a slower version of the same problem.
Even worse, most general BI tools <highlight-pink>weren’t designed with UA in mind<highlight-pink>. Sure, they can show you revenue trends, but predictive ROI or LTV modeling doesn’t come out of the box. To get there, you need a full BI team: datasets wired in, data scientists to build ML models, engineers to integrate them, and months before you see a working forecast. And even then, standard BI rarely covers the messy realities of growth marketing — SKAN gaps, refund rules, App Store commissions, or stitching web and app flows together. Out of the box, BI gives you raw data; turning it into predictive signals is a separate, expensive project.
And then there’s <highlight-pink>process rigidity<highlight-pink>. Even with a solid BI team, updates move at the pace of backlogs. You might get a beautiful dashboard with trial conversion by cohort, but it doesn’t break down by geo, subscription type, or creative. Want to know which ad set is pushing high-churn users in Italy? That’s not in the schema. Try again next sprint.
Most BI systems also depend heavily on backend logic from MMPs or App Store reports, which means they inherit the same blind spots. Probabilistic SKAN attribution? Broken. Web-to-app flow tracking? Incomplete. You still can’t see what’s actually driving value, only what happened after the fact.
There’s a reason so many growth teams quietly maintain a spreadsheet next to their Looker board. One gives you data. The other gives you answers.
In the next section, we’ll look at what modern predictive UA tools do differently and how they give teams the speed, precision, and confidence that neither spreadsheets nor BI stacks can deliver.
<highlight-green>Want to see what skipping the BI build actually looks like in practice?<highlight-green>
Check out how app publishers scaled x10+ revenue in six months without sinking time or budget into building an in-house BI system.
[Read the case studies →]
.webp)
Why SaaS BI beats both spreadsheets and in-house BI tools
Spreadsheets let you move fast until you scale.
In-house BI gives you structure until it slows you down.
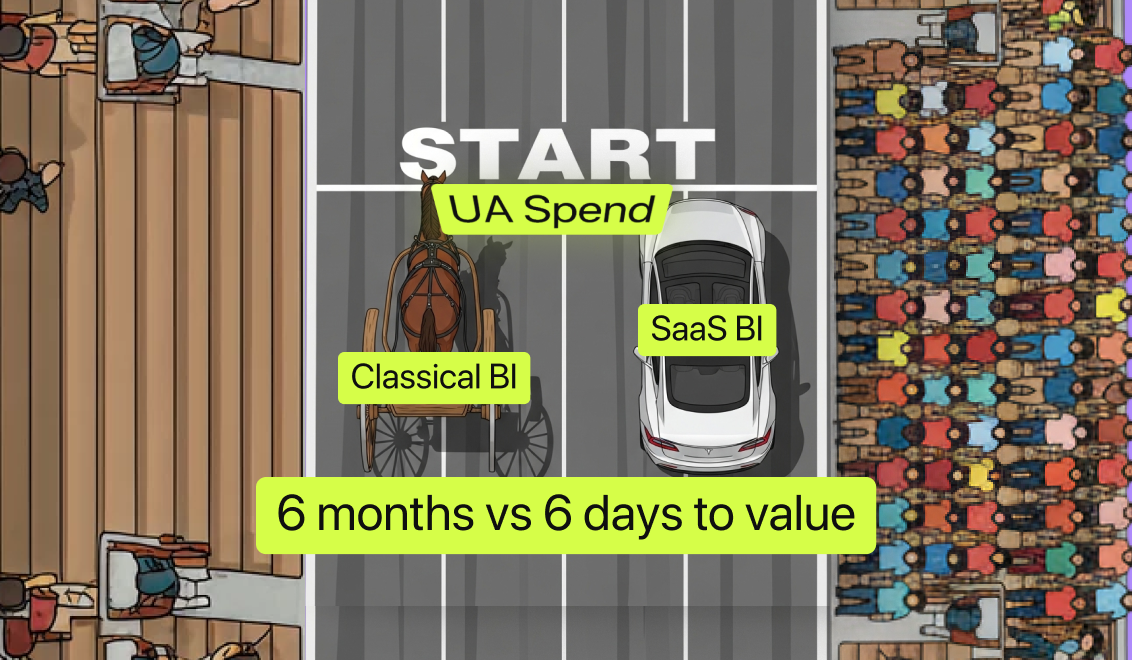
Campaignswell is something else entirely: a SaaS BI platform built specifically for UA teams who need predictive ROI and fast LTV modeling. Think of it as your full-funnel, predictive analytics system without the cost, lag, or overhead of building it yourself.
Where spreadsheets crack under scale, and internal BI takes quarters to launch, Campaignswell gives you:
- Daily-updating dashboards with predictive ROI, ROAS, LTV modeling, CAC
- Granular cohort views by channel, geo, creative, plan, funnel stage
- A clean UI built for marketers, not analysts
- Instant signals when performance shifts so you can act, not react
Unlike general-purpose analytics, <highlight-green>Campaignswell is purpose-built for growth teams handling $50K–$5M+<highlight-green> in UA spend across mobile and web, with real monetization complexity at play.
And it works across the entire org:
- UA leads scale what’s working faster, with predictive LTV by campaign and creative
- Creative teams kill burnout before it burns budget
- Product and monetization teams track paywall changes and onboarding experiments with real revenue impact
- Finance and leadership get a single, trusted view of margin, ROI, and growth velocity, no more clunky Looker exports
Campaignswell does the heavy lifting your internal BI team would do (if you had one) from data stitching to ML forecasting to cohort logic, but it runs as a plug-and-play SaaS tool. You connect your ad accounts, your revenue sources, and it just works.
Spreadsheets can’t scale with you. Internal BI slows you down.
SaaS BI keeps you moving and gives you the signal to grow.

When should you switch? Signs you’ve outgrown spreadsheets
There’s a moment in every growth team’s journey when the old way stops keeping up. Sometimes it’s subtle, like weekly reports taking longer to update. Sometimes it hits harder, like blowing $50K on a campaign that looked good in your spreadsheet but churned in week two.
Here are the signs it’s time to upgrade to a SaaS BI tool like Campaignswell:
1) You’re spending over $50K/month and can’t afford to wait days for answers
At this scale, lag costs real money. Whether you’re scaling a winner or stopping a loser, timing is everything, and predictive ROI signals are what make the difference.
2) You’re working across multiple geos, platforms, or subscription plans
Currency conversions, tax logic, App Store fees, cohort behavior — all vary by market. If you’re managing this in a spreadsheet or general-purpose BI dashboard, it’s only a matter of time before something breaks.
3) Your UA, product, and finance teams don’t share the same numbers
When creative performance lives in one dashboard, trial conversion in another, and LTV forecasts in a spreadsheet no one trusts, decisions slow down. Or worse, they get made on conflicting data.
4) You rely on MMP dashboards or static BI but still feel blind on iOS or cohort ROI
SKAN gaps. Web-to-app flows. Trial-to-subscription falloff. These don’t show up cleanly in MMPs. And traditional BI tools weren’t built to handle predictive modeling or attribution logic at the level UA teams need.
5) Your team is spending hours stitching reports together
If it takes two people and three tools just to figure out yesterday’s ROAS, you’ve already outgrown your setup. That’s time you could be spending running creative tests, optimizing funnels, or scaling what’s working.
Campaignswell was built for this inflection point.
When you’ve hit real budget, real growth, and real operational complexity, but don’t want to burn another six months building tooling from scratch.
One platform for all your data: comparing Google Sheets, in-House BI, and SaaS BI
When UA spend ramps up, so do the demands on your analytics. Here's how the three common approaches compare when it comes to scaling performance marketing.
Real Stories: scaling faster with campaign ROI analysis in SaaS BI
Every team we work with has the same story at the start: too many tabs, not enough clarity. Some were buried in spreadsheets, some sunk months into building BI, others juggled half a dozen tools that never lined up.
The real shift happens when they replace that chaos with one predictive source of truth. Instead of debating numbers, they act on them. Instead of guessing whether a funnel will pay off, they know by day three. Instead of waiting for analysts, every marketer has the signal in front of them.
Here are a few examples of what that looks like in practice:
AIstats: From $5K budget to $150K MRR without a BI team
This mobile analytics startup didn’t waste time building dashboards. They plugged into Campaignswell from day one, ran UA with predictive LTV and ROI forecasts, and scaled revenue 30x in a year without ever hiring analysts.
AI Companion App: 10x scale with confidence
They were ready to scale, but juggling multiple agencies, disconnected dashboards, and SKAN gaps kept slowing them down. In-house BI would have taken 6+ months. Instead, Dialogue AI switched to Campaignswell. Within a year, spend, subs, and profit grew 10x. Predictive ROAS gave the team confidence to scale without guessing.
Multi-vertical mobile app studio: from manual chaos to scalable growth
For this app studio, every decision meant CSV exports, mismatched dashboards, and second-guessing ROI. Campaignswell gave them clarity. With predictive LTV and geo-level signals, they scaled UA from ~$50K to $165K/month — comfortably.
AI Companion App funnel test: 20% of revenue in 6 months
One team wanted to test a new web-to-app funnel without gambling six figures. With Campaignswell, they forecasted revenue potential, cut losses early, and scaled winners. Within six months, the funnel contributed 20% of company revenue.
Lumos VPN: aligning UA, product, and finance
Different teams had different numbers. UA swore campaigns were working, finance disagreed, product wasn’t sure. Campaignswell unified everything — ad spend, cohorts, monetization, SKAN modeling — into one trusted view. ROI on iOS jumped from 7% to 50% in six months.
Conclusion: scaling UA growth with predictive lifetime value and ROI clarity
Running UA on spreadsheets is like juggling chainsaws: impressive for a while, but eventually something drops. Building BI in-house is more like knitting your own parachute while the plane’s already in the air. Maybe it holds together eventually, but until then, you’re free-falling.
SaaS BI was built for teams who don’t have time for stunts. Plug in your channels, connect revenue, and you’ve got daily LTV modeling, predictive ROI, and creative insights — ready when you are.
That’s why companies from lean startups to big-budget app teams are using Campaignswell to keep scaling sane. They’re spotting creative fatigue before it drains budget, running funnel experiments without sleepless nights, and actually agreeing with finance for once.
👉 Ready to see your numbers finally make sense?
[Book a demo with Campaignswell]

Co-founder & CEO at Campaignswell


