How top apps use predictive analytics to cut churn and boost ROI


Predictive analytics techniques without the boring dits
Some apps feel like they’re one step ahead of you. They know when you’re about to skip the gym, when you’re ready to binge-watch, or when you’ll cave in and order that late-night burger. That’s predictive analytics shaping the apps people open every day, quietly driving retention and revenue through the product itself.
And here’s the kicker: these aren’t experiments running in some lab. They’re polished, battle-tested models already shaping user experiences, reducing churn, and driving demand forecasting in some of the world’s most popular mobile apps.
We’ve pulled together a lineup of real examples of predictive analytics in action. Apps that are quietly proving how powerful smart data analytics can be when it’s wired straight into the user journey.
Customer segmentation and data analytics examples from Netflix, Spotify and Amazon
Netflix, Spotify, and Amazon are some of the strongest predictive analytics examples because they’ve baked forecasting into the core of their products. What looks like a content feed or playlist on the surface is really predictive analytics work running in the background, shaping retention, LTV, and ROI.
Netflix
Netflix builds its viewing experience around recommender systems. Over 80 % of what people watch comes from Netflix’s personalized recommendations. These systems organize viewers into varied “taste communities” and use machine learning and collaborative filtering to continually surface the most relevant titles. For growth marketers, this is a clear lesson: integrate predictive analytics models that segment user groups and guide content discovery ahead of churn.
Spotify
Spotify turned prediction into a ritual. When Discover Weekly launched, more than half of users saved at least one track, and those listeners streamed over twice as long as others. The playlist is fueled by collaborative filtering, machine learning algorithms, and models that detect listening patterns across billions of plays. For marketers, this is one of the clearest predictive analytics examples for turning casual users into loyal ones: when you serve what they’re about to want, lifetime value grows naturally.
Amazon
Amazon’s mobile app predicts shopping behavior at the exact moment a customer browses. Its item-to-item collaborative filtering combines data points from browsing and purchase history to surface products most likely to land in the cart. That’s not random suggestion; it’s real-time demand forecasting stitched into the buying journey. For performance marketers, this shows how AI-powered models can directly impact conversion rates and push campaign ROI higher without added friction.
Takeaway for marketers
These three don’t just recommend; they program the surface users land on with prediction. Think of the home screen, the first playlist, the product grid. That surface is the growth lever. A few moves worth copying:
- Give prediction a prime slot. Netflix makes the row order the product. Spotify turns a weekly playlist into an appointment. Amazon lines up “next best items” right on the PDP. Pick one high-traffic surface in your app and let a predictive ranker own it.
- Build a ritual around your model. Discover Weekly works because it arrives on the same cadence and feels fresh. Create a recurring “prediction drop” in your app (weekly plan, recovery picks, next-best class) and train users to come back for it.
- Solve cold start with clusters. Netflix’s “taste communities” and Amazon’s item-to-item approach reduce how much historical data you need. Use lightweight signals from onboarding, device, and first-session behavior to place a new user into a cluster and start personalizing immediately.
- Explain the pick. “Because you watched…” or “Because you added…” boosts trust and CTR. A simple reason label helps users accept the prediction and teaches the model faster through cleaner feedback.
- Optimize for downstream value. These platforms tune rankers to retention and spend, not superficial taps. Tie your predictive surface to LTV or day-7 outcomes, then judge it on incremental lift.
- Close the loop with marketing. Feed what the product learns back into UA. If the model predicts “strength training at 7pm” for a cohort, mirror that in creatives, time your pushes, and bias budget to channels where that cohort over-indexes.
- Measure like a campaign. Treat the ranker as always-on media. Set up holdouts, run geo or cohort-level A/Bs, and track incremental retention and order value. When it outperforms static layouts, scale it like you would a winning ad set.
Drop this mindset into your app and predictive analytics work stops being background math. It becomes the layer where users decide to stay, engage, and spend.
How predictive data analytics improves customer experiences in fitness apps
Fitness apps attract millions of sign-ups, but the real challenge is keeping people around after the first week of enthusiasm. Predictive analytics gives these apps a way to spot fading motivation or risky behavior early and step in with the right response. By applying data analytics and predictive models to user behavior, they can predict reveneu and act before churn happens.
Fitbit
Fitbit applies predictive analytics models to inputs like sleep quality, heart-rate variability, and recent activity. These signals roll up into the Daily Readiness Score, a forecast that tells users if today is for training or recovery. As a predictive analytics example, it shows how complex data can be turned into simple, actionable guidance. The score translates biometrics into daily customer experiences that feel personalized. By flagging risks like fatigue before they cause drop-off, Fitbit uses analytics to forecast future outcomes and keep people engaged over the long run.
MyFitnessPal
Food logging fatigue is real — nobody likes typing the same breakfast every day. MyFitnessPal tackled this with data analytics features like Remembered Meals and Suggested Searches, which cut the effort of repeat logging. These shortcuts don’t look flashy, but they directly reduce drop-off in the core habit loop. Beyond the app, researchers have used MyFitnessPal’s massive dataset to train predictive models and run machine learning studies on eating behavior. It’s one of the clearest predictive analytics examples of how everyday logs can be turned into insights that anticipate user needs and smooth the path to long-term retention.
Garmin
Garmin’s Training Readiness feature is built on multiple inputs: sleep score, recovery time, HRV status, acute load, and stress history. The score updates throughout the day, giving users a dynamic forecast of how prepared their body is for effort. It’s a clear predictive model in action: raw signals become a readiness score that influences real choices. Instead of browsing metrics, users get guidance they can act on, which creates stronger user engagement. By helping people balance stress and recovery, Garmin shows how predictions can forecast reveneu and keep motivation intact.
HealthifyMe
HealthifyMe’s AI nutritionist Ria was built on over 150 million food logs and 10 million user-coach messages. It autonomously handles around 80% of user queries, drawing on patterns in eating habits and workout behavior to deliver personalized, timely guidance. Ria remains one of the clearest examples of predictive analytics in wellness—where AI translates behavior logs into practical nudges that shape long-term engagement. For marketers, it’s a strong case for using machine learning to anticipate user needs and scale personalization at low cost.
Takeaway for marketers
- Build one predictive signal into the daily flow. A single predictive model tied to health or activity data can anchor routines far better than dashboards full of stats.
- Use customer data to eliminate friction. Predictive features that prefill, autocomplete, or anticipate next actions often add more stickiness than entirely new features.
- Design interventions around risk factors. Look for signals of fatigue, missed streaks, or slowing activity, and connect them to proactive nudges before engagement collapses.
- Treat predictive analytics capabilities as growth levers. When they forecast reveneu that matter to users, the result is higher retention and stronger LTV.
Classification models and data science in women’s health apps
Women’s health apps are a prime example of how classification models move beyond dashboards and into real life. In Clue and Natural Cycles, cycle logs and temperature data are transformed into forecasts that guide real decisions around fertility and planning. For marketers, they show how data science applied to highly personal behaviors can create trust and long-term engagement.
Clue
Clue collaborated with researchers to analyze over 79 million menstrual cycle logs from more than 65,000 users. With logistic regression classifiers and machine learning, they predicted the probability of pregnancy within the next six cycles. Women in the top prediction group had an 89% chance of conceiving, compared to 27% in the lowest group. This is classification at scale: simple models plus massive datasets producing life-changing forecasts and stronger user engagement.
Natural Cycles
Natural Cycles uses classification models to sort days into fertile or non-fertile based on basal body temperature and cycle data. Certified by the FDA and CE as a medical device, its algorithm helps women make informed choices about conception or contraception. For marketers, it’s a clear predictive analytics example of how binary classification tied to personal outcomes can sustain user trust, reduce churn, and differentiate a brand in a competitive market.
Takeaway for marketers
- Reliable predictions build trust because they touch outcomes that matter deeply. This creates long-term customer experiences that are harder to copy than features.
- Growth teams can apply the same principle: identify the most critical risk factors in your product and train a classification model to predict them.
- When forecasts connect directly to user decisions, predictive analytics work as an engine of retention and LTV, not just as reporting.
Fraud detection predictive analytics in health and subscription apps
Fraud often hides in the background of health and subscription businesses, quietly draining ROI. Fake claims, duplicate accounts, and suspicious billing cut into revenue and at the same time distort the data that predictive analytics relies on.
Health insurance fraud detection
In one large-scale study with over 380K insurance claims, predictive models identified 38K fraudulent cases with more than 97% accuracy. These examples of predictive analytics show how models trained on usage and billing patterns can detect anomalies long before human auditors could. For growth strategists, the message is clear: predictive analytics work best when fraud signals are treated as early warnings, not as end-of-quarter write-offs.
MediBuddy (healthcare platform)
MediBuddy, a healthcare platform, applied data science to spot risk patterns in real time: duplicate claims, forged documents, and unusual pricing behavior. The system automatically flags anomalies and saving revenue by keeping legitimate claims fast and smooth.
Takeaway for marketers
Fraud detection may sound like an ops problem, but it directly impacts growth. Clean data means better models, higher ROI, and more reliable predictive analytics examples across campaigns. If your app handles subscriptions, payments, or health data, build fraud detection into your predictive layer not only to reduce losses, but to make every downstream forecast sharper.
Customer churn and customer behavior: how predictive analytics keeps users from leaving
Every app marketer knows the painful truth: installs don’t mean much if users churn in the first weeks. Predicting churn has become one of the most valuable examples of predictive analytics, because it turns raw data about user activity into early-warning signals that growth teams can act on. This is where data science delivers practical value, translating complex patterns into clear actions.
Snapchat
Snapchat leverages interpretable machine learning models for churn prediction, clustering new users based on activity data to identify early drop-off risks. This informs targeted interventions like feature highlights or notifications to retain users. The method highlights how predictive analytics work in social apps where churn rates are high, though specific quantitative outcomes aren’t detailed in public studies.
Hydrant (wellness subscription app)
Hydrant uses AI-powered churn prediction on customer data to identify at-risk subscribers, enabling targeted retention campaigns like discounts or reminders. These interventions improved customer experiences by making reminders and offers feel timely rather than generic. The churn reports became a forecasting layer that allowed growth teams to anticipate future outcomes and cut revenue leakage.
Cured Nutrition (wellness brand, subscription-focused app)
Cured Nutrition, a wellness brand offering supplements for sleep, stress, and focus, applied predictive analytics tools to subscriber behavior. By analyzing order patterns and feedback, the brand identified churn signals, especially after the third processing cycle. A retention campaign with personalized incentives drove a 16% increase in orders after the third cycle and a 24% lift in subscription revenue quarter over quarter. Orders beyond six cycles rose 18%, proving that targeted predictive analytics examples can extend LTV. With no-code automation tailoring offers to behavior, churn dropped, loyalty strengthened, and recurring revenue grew.
Takeaway for marketers
- Treat churn prediction as a core part of your predictive analytics capabilities, not an afterthought. Build it into the same workflows you use for UA and monetization.
- Don’t just measure churn rates; use forecasting models to highlight specific warning signs along the customer journey and act before users disappear.
Shift focus from reporting the past to using data science that can forecast future outcomes when churn is likely, and which interventions are worth the spend. - Test churn-save actions the same way you test UA: A/B holdouts, measure lift, and iterate. That’s how you prove predictive analytics work beyond dashboards.
Demand forecasting examples in food delivery and health apps
If predictive analytics is about anticipating what comes next, then demand forecasting examples are some of the clearest ways to see it in action. For mobile apps, predicting when and where demand will surge means smoother operations, smarter campaigns, and stronger ROI.
Uber Eats
Uber Eats relies on demand forecasting to keep deliveries both efficient and profitable. Its machine learning algorithms are trained on historical data like restaurant prep times, driver locations, and traffic conditions. By layering these signals, the company improved delivery-time predictions by 26%. More accurate ETAs cut costs and, at the same time, make the service more reliable for customers. When meals show up when expected, satisfaction grows, repeat rates climb, and loyalty strengthens. For growth marketers, this is one of the strongest predictive analytics examples: operational forecasts that started as back-end optimizations now drive front-end trust and retention.
Deliveroo
Deliveroo leans on predictive modeling to keep its system balanced in real time. The algorithm estimates how long meals will take to prepare and how many riders should be on the road. When demand spikes, driver pay adjusts instantly to pull more couriers online. That balance keeps orders moving smoothly, reduces delays, and makes the whole operation scale even when demand is unpredictable.
Glovo
Glovo’s analytics system forecasts consumer demand across 97 cities with 96.2% accuracy. It uses data from over 27 external sources including mobility patterns, pricing signals, and search behavior to predict which products to stock and promote. This setup illustrates how detailed, data-driven forecasting can support real-time decisions in both inventory and marketing.
Takeaway for marketers
- Treat forecast accuracy as part of your brand. If users see that your predictions consistently match reality, whether it’s delivery, wait time, or workout readiness, you’re not just reducing churn, you’re training trust.
- Build models for both sides of the equation. Don’t stop at predicting user demand; forecast your own capacity to meet it. Balance expected spikes in activity with inventory, support, or server resources so the experience scales smoothly.
- Expand the signal set. The most valuable demand cues often come from actions that didn’t complete — searches, abandoned carts, unfinished forms, skipped screens. Feed those into your models to see demand before it shows up in transactions.
- Use demand forecasts to time your marketing. Align campaigns, push notifications, and even UA bids with predicted peaks in user intent. It’s cheaper to meet demand at the right moment than to manufacture it later.
- Let operations data guide creatives. If forecasts show a pattern (like evenings, certain categories, or seasonal peaks), reflect that in ads and CRM content. Marketing lands harder when it matches the predicted context users are already in.
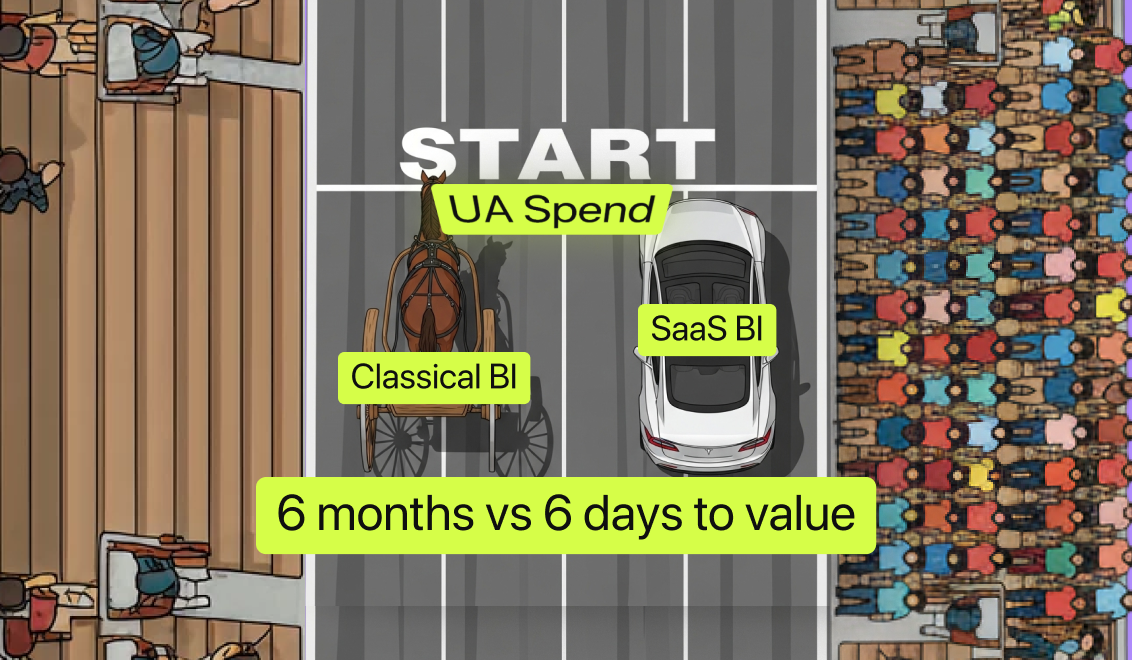
Examples of predictive analytics potential in Campaignswell case studies
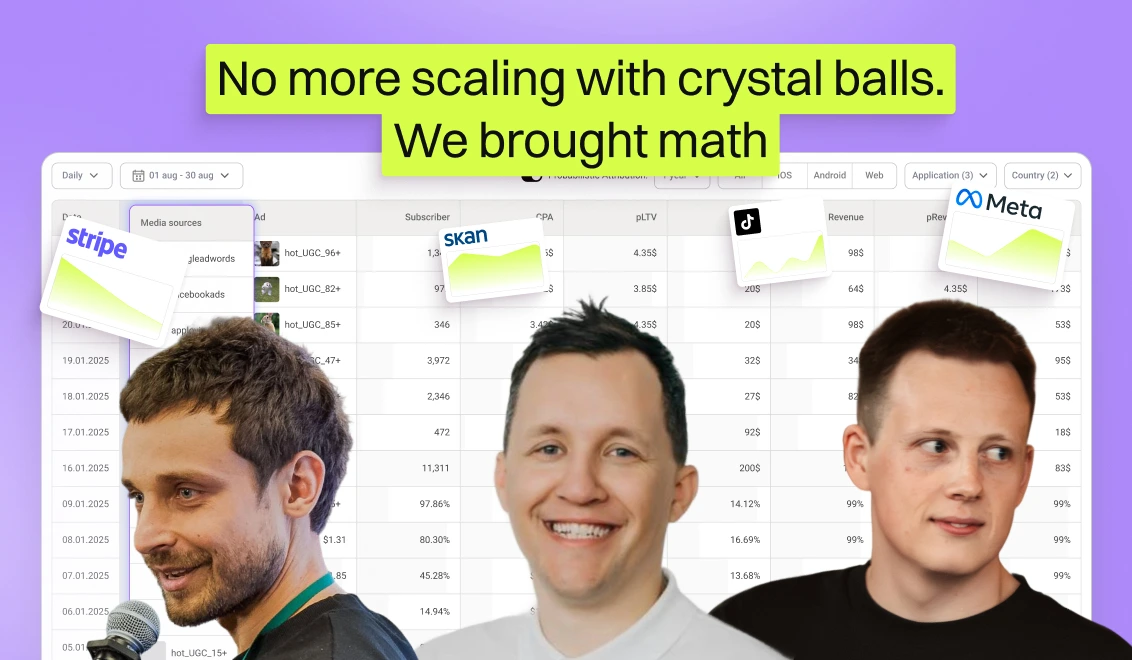
In this article we’ve looked at global apps, but our own work with clients is also full of examples of predictive analytics. Campaignswell is a SaaS BI built for app growth. It pulls in data from ad networks, MMPs, subscription platforms, and product analytics, then unifies it into a single source of truth. On top of clean pipelines, it runs predictive models — LTV forecasts, churn risk, campaign ROI projections. That combination of BI and prediction means you don’t just get reports on past performance, you get forward-looking signals that guide budget, creatives, and funnel strategy.
How Campaignswell clients use predictive analytics for data driven decisions
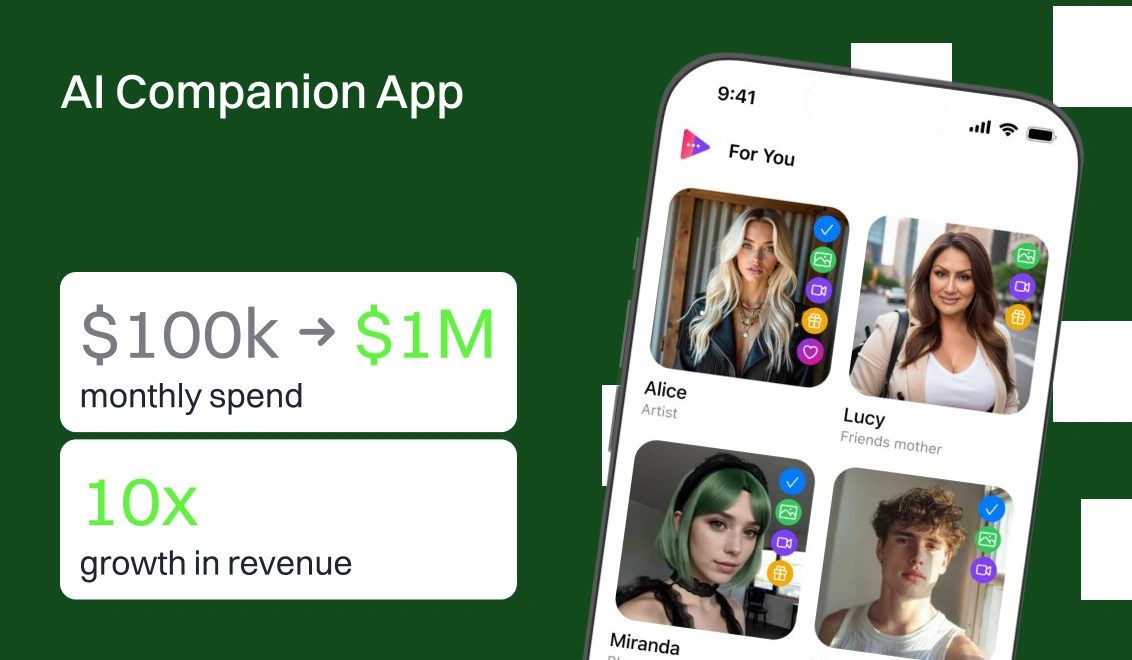
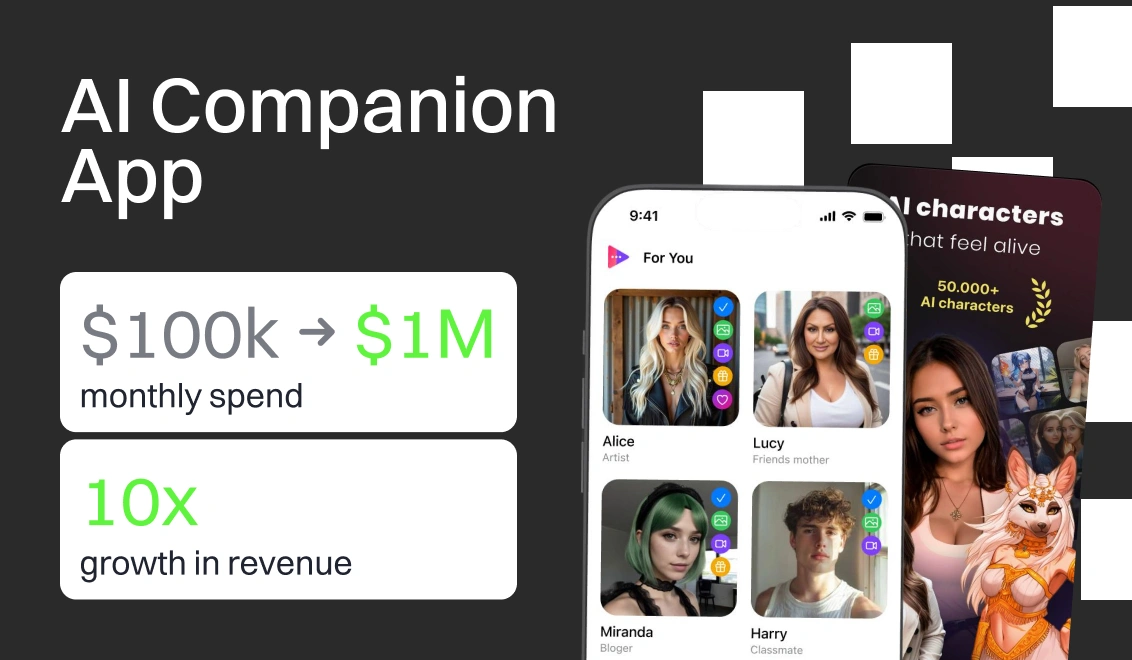
AI Companion App scaled 10x. By unifying ad spend, agency, and app metrics, then applying data science for LTV forecasts, this subscription app was able to scale spend and profit by 10x.
Mobile analytics startup grew MRR 30x. At the start of paid UA, the team had no BI system or attribution stack, so spend decisions hung on a simple CPA ceiling. After plugging in Campaignswell, they worked off pLTV and ROI forecasts with a clear 30% ROI benchmark and launched a Web2Web funnel whose. LTV beat prior cohorts by 20–25%. In 12 months MRR rose from ~$5K to ~$150K.
AI companion app: web-to-app funnel drove 20% of revenue. Campaignswell unified ad spend, onboarding/trial behavior, and Stripe/PayPal/App Store revenue in one view and ran predictive LTV from day one, so the team could scale strong funnel variants fast and cut weak paths early; within six months the web-to-app journey contributed 20% of total revenue.
Multi-vertical mobile app studio tripled UA spend. Instead of juggling spreadsheets, MyApps used Campaignswell’s data visualization of CAC and LTV forecasts. Clear visuals plus predictive models gave them the confidence to grow from $50K to $165K/month.
Lumos VPN unlocked 50% ROI. Lumos unified Apphud, Singular, and Stripe data. Campaignswell’s predictive layer turned this into a single view of ROI, proving how examples of predictive can translate directly into financial outcomes.
👉 You can dive deeper into our case studies or book a demo to see how Campaignswell powers prediction in practice.

Co-founder & CEO at Campaignswell
Book a demo


Co-founder at Campaignswell
Use the session to ask your hardest questions about scaling, LTV, or attribution, and see how full-funnel predictive analytics gives you clear, actionable answers.
Why your Subscription App can’t break the $100K/Month ceiling without losing revenue


71 takeaways mobile app publishers can use to improve monetization strategy and LTV
10 monetization mistakes that hold back subscription apps