Why mobile attribution modeling fails: the hidden gaps in your marketing stack that cost you $100K+

POV: You’re scaling fast. Budgets are growing, new channels are opening up, your team is shipping creative tests like clockwork. You’ve got dashboards, attribution tools, MMP reports. Everything looks under control, on the surface.
REAL: Somewhere between your ad spend and your revenue, money is leaking. One of our clients learned the hard way before they came to us for a solution. For six months they miscalculated their core unit economics because of attribution and revenue disconnects. As a result, they ended up making budget decisions based on inflated revenue numbers and burned through six figures before realizing what was happening.
We know this pain firsthand. Before building Campaignswell, our founders ran UA and analytics at scale and faced the same cracks: installs that didn’t match revenue, cohort LTVs that didn’t line up with what was actually hitting the bank, signals lost in SKAN. Those gaps made it nearly impossible to make the right budget calls. That experience is exactly why they built Campaignswell: to close the holes that eat budgets and stall growth.
This text is about those gaps. We’ll show why an MMP alone doesn’t give you the full picture, what hidden problems this creates when budgets scale, and how Campaignswell closes these gaps so you can finally make budget decisions based on data, not intuition, and confidently increase not only your scale 10x+, but also your revenue.
The limits of MMPs and why attribution modeling goes further
For many teams, bringing in an MMP feels like finally getting control. The chaos of channel dashboards and spreadsheets settles down, installs have a clear source, and reporting looks cleaner. It’s a relief and it works, to a point.
But here’s what happens once budgets grow and the funnel gets more complex. That clarity starts to blur. On iOS, SKAN hides large chunks of performance data, and what you do see often arrives with delays. Probabilistic attribution can fill gaps, but its reliability depends on signal volume and quality. RevenueCat notes it’s “less hard” to make probabilistic models work accurately when you have so many data points, and advises caution because modeled attribution often inflates performance, so you must cross-reference other data sources. Adjust similarly states probabilistic attribution will never be as accurate as SKAdNetwork (deterministic) and should be used with care.
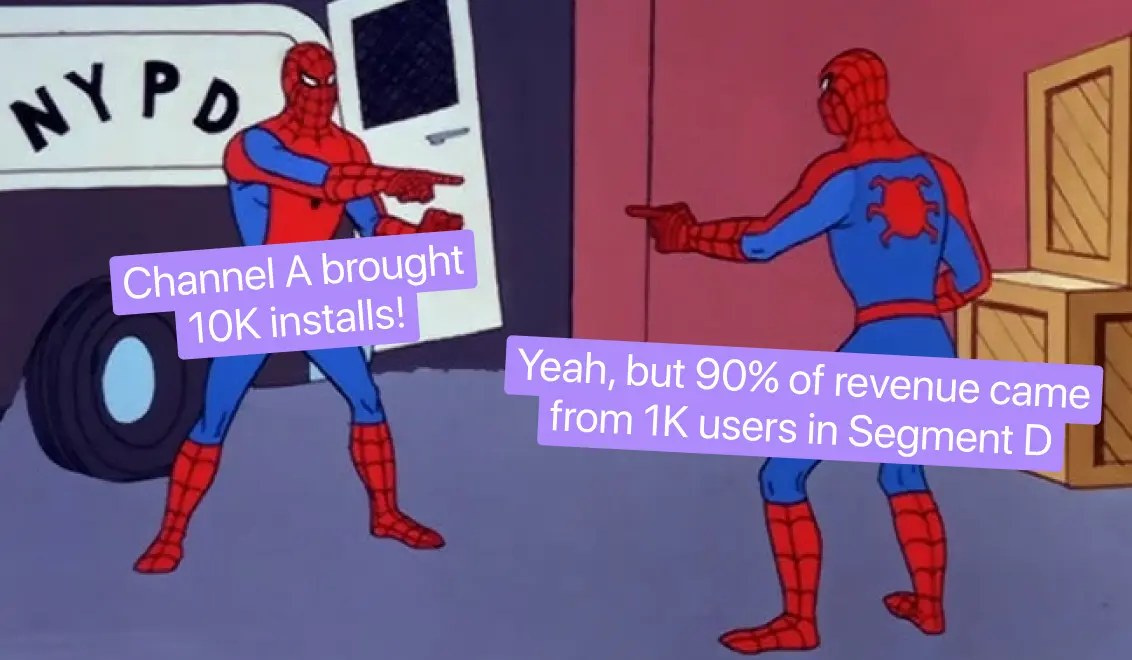
In practice, this means you think you know which channel or campaign is driving results, but the numbers don’t always tell the same story. One side of your dashboard shows installs flowing in, while revenue or retention data tells a different story altogether. That disconnect is the hidden cost of relying only on install attribution.
MMPs are still essential. They give you the foundation every growth team needs. But attribution at the install level isn’t the full picture. What’s missing is attribution that connects installs to actual revenue, accounts for refunds, bridges web and app flows, and fills the visibility gaps left by SKAN.
There’s another layer to the problem. Even when you’ve nailed mobile attribution, MMPs start to drift once the setup gets complex. Multi-platform funnels — web2app, cross-device, subscription + in-app — are outside their comfort zone. They can show installs and spend, but they can’t reliably map full-funnel performance when traffic moves between environments.
And then there’s the conflict with self-reported networks like Meta, TikTok, Google, and Snap. Each of them runs its own attribution logic, often claiming the same conversion. As a result, you have a double-counted revenue, inflated ROAS, and UA teams making calls on phantom profit.
This is the gap Campaignswell was built to close. Here’s how it works:
- We pull the raw install-level signals from your MMP, whether it’s Adjust, AppsFlyer, or another.
- We connect that data with real revenue sources like App Store, Google Play, Stripe, and Paddle.
- Our machine learning models reconstruct the missing links SKAN hides, using probabilistic attribution that has been trained on full-funnel data.
The result is a reliable attribution that shows how each campaign and creative drives revenue, retention, and LTV.
Instead of just knowing where installs came from, you finally see which channels and creatives actually drive profit. That’s attribution you can act on.
[[cta1]]
Data-driven attribution starts with revenue, not installs
Revenue is where smart UA turns into real business results. And it’s also where most reporting goes off the rails. Here are the four traps we see again and again, and how we fix them.
1) Cash vs accrual, and “proceeds” vs gross
The trap: App Store and Google Play report proceeds (after fees and taxes) on a monthly cadence. Marketing looks at daily gross expectations. Different clocks and definitions create false wins and false negatives.
How we fix it: Campaignswell gives you dual views: cash for day-to-day pacing and accrual for unit economics. We normalize gross vs net, surface store fees and taxes as separate fields, and keep your ROAS/ROI logic consistent.
2) Refunds and chargebacks that hit late
The trap: Refunds land days or weeks after the original purchase and often get backdated in vendor UIs. Your day-level ROI drifts, cohorts warp, and yesterday’s “winner” turns out to be mediocre.
How we fix it: We reattach each refund to its original transaction and cohort, continuously recompute pLTV/ROAS, and show an impact delta so you see exactly how margins change.
3) FX and taxes hiding in plain sight
The trap: Currency conversion and VAT vary by country and period. Comparing geos or rolling up to a single currency introduces stealth errors.
How we fix it: We lock transaction FX at purchase time, expose VAT/taxes as explicit fields, and let you flip views between local and reporting currency without breaking your ROI math.
4) Data windows and payout lags
The trap: Apple’s fiscal calendar and Play’s monthly earnings mean long lags and partial months. Day-to-day reconciliation with ad spend won’t line up.
How we fix it: We surface data freshness and lag, flag partial months, and give you predictive series (pLTV/pROI) so you can act before the books close.
5) Manual spreadsheets and reconciliation hell
The trap: Many teams still patch revenue together manually: exporting CSVs from App Store, Google Play, Stripe, then stitching them to ad spend in spreadsheets. It eats hours every week and introduces errors at every copy-paste.
How we fix it: Campaignswell automates ingestion across all revenue sources and ad platforms, reconciles them into one schema, and updates daily. That means no more spreadsheet gymnastics, just one clean view you can trust.
Campaignswell turns revenue from a messy afterthought into a reliable decision layer. Your “R” stops wobbling. Your ROAS starts reflecting reality.

Cross-channel attribution: where your dashboards stop talking to each other
Every growth team says the same thing: too many dashboards, none of them agree.
You’ve got ad spend in Meta and TikTok, installs in your MMP, revenue in App Store or Stripe, retention in Firebase, finance looking at payouts. The numbers don’t match, they never do. One dashboard says the campaign is crushing it, another says you’re bleeding money. Which do you trust?
That’s why half the industry quietly runs on Excel. Because the “official dashboards” look slick but break down the moment you ask for something useful, like ROAS by creative. And when finance asks why their store numbers don’t match marketing’s MMP report, trust in the dashboards falls apart completely.
The consequences are serious:
- Overspend gets missed because the right view was buried in browser tabs.
- “Winners” get scaled based on installs, only to find revenue doesn’t add up.
- UA and finance waste hours reconciling reports instead of making decisions.
- Teams stop trusting dashboards at all and go back to manual spreadsheets.
That’s what siloed dashboards cost you: speed, trust, and money.
How Campaignswell fixes it
We pull all those siloed views into one schema: spend, installs, revenue, refunds, retention. SKAN delays and payout lags? Normalized. Campaign, creative, cohort breakdowns? Always there. UA, growth, and finance look at the same numbers, finally. When the silos disappear, so do the mistakes.

From creative guesswork to data-driven attribution
Most marketing stacks can track spend, installs, and revenue, but they rarely provide a reliable view of how individual creatives contribute to long-term growth. This creates several recurring problems.
Decisions based on shallow metrics
Creative performance is usually evaluated on CTR, CPI, or install volume, because those are the metrics ad platforms and MMPs expose by default. The problem is that installs do not reflect user quality. A creative that looks like a top performer on CPI can ultimately deliver low retention and weak lifetime value.
Fatigue goes unnoticed until it is costly
Every creative has a limited lifespan. Performance peaks, then gradually declines. Most tools do not highlight this decay early enough, so budgets continue to flow into ads that no longer generate returns. By the time the trend is visible in revenue reports, a significant share of spend is already lost.
Inconsistent reporting across platforms
The same creative often appears to perform differently across Meta, TikTok, MMP dashboards, and internal BI tools. Each system applies different attribution logic, reporting windows, and definitions. This inconsistency makes it difficult for teams to determine which creatives are truly driving revenue and retention.
Strategic consequences
When creative analytics lacks depth and consistency, teams hesitate to scale promising campaigns, continue funding underperforming ads, and spend disproportionate time reconciling conflicting dashboards. The result is slower decision-making, budget inefficiency, and missed opportunities for growth.
How Campaignswell connects creative attribution to the full customer journey
Campaignswell links creative performance directly to revenue, retention, and predicted lifetime value. Creative variants are grouped automatically, fatigue trends are flagged early, and performance is normalized across platforms. In addition, Campaignswell applies cohort-based analysis at the creative level: every ad is evaluated not just on the installs it generates, but on the long-term behavior of the users it attracts. This makes it clear which creatives bring in cohorts that retain and monetize, and which ones drive users who churn quickly.
This approach allows marketing and leadership teams to evaluate creatives on profit rather than surface-level metrics, and to scale with greater confidence.
Why attribution modeling without prediction kills growth
How much budget do you let run before you know if a campaign is truly profitable? At scale, waiting weeks for clarity can cost hundreds of thousands.
Most stacks report what happened yesterday, but they can’t reliably show what’s ahead. Early signals like clicks, installs, or day-1 retention rarely map to long-term value. On iOS, SKAN data arrives late, aggregated, and stripped of detail. User behavior shifts quickly, and models trained on old cohorts drift out of sync.
The consequences are clear: budgets continue in campaigns that are already in decline, high-value cohorts aren’t recognized in time to scale, and revenue forecasts for leadership are consistently behind reality.
Why it happens
- Noisy early signals. Clicks and installs may indicate volume, but they say little about quality. Cheap users inflate CPI and CTR metrics but contribute little revenue.
- Privacy limits. SKAN on iOS reduces the predictive signal even further by delaying, aggregating, and randomizing postbacks.
- Model drift. Predictive models trained on yesterday’s cohorts quickly become unreliable when seasonality changes, competition shifts, or platforms update policies.
- Lack of trust. Predictions presented as single opaque numbers rarely inspire confidence; without context or explanation, they are ignored.
How Campaignswell builds predictive attribution modeling that closes the gap
Campaignswell integrates clean spend, revenue, and retention data to feed predictive models that are retrained continuously to reduce drift. We generate forward-looking metrics such as pLTV and pROAS at the campaign and creative level, enriched with cohort-based analysis. Instead of opaque forecasts, we provide trends, confidence ranges, and cohort breakdowns that show where growth is most likely to come from.
This gives UA leaders and executives a reliable forward view of performance. You don’t only see what worked last week, you see where the next dollar should go today.
[[cta1]]
The best attribution model for modern marketing teams
Most teams start their analytics journey with an MMP and that’s okay. Mobile Measurement Partners are great at attributing mobile traffic and giving install-level visibility. Mature growth teams know that’s their main use case: attribution, not performance tracking.
The trouble begins when you expect your MMP to do more than it’s built for. MMPs don’t model iOS attribution, they miss web-to-app and multi-touch attribution paths, and they don’t include refunds, taxes, or store fees. As a result, you have miscalculated unit economics and inflated ROAS that lead to poor budget allocation.
Your data then splinters across marketing channels and marketing campaigns, leaving your team juggling multiple dashboards, conflicting attribution data, and a blurry view of your customer journey.
The best attribution model solves this by going beyond installs and clicks. It connects every touchpoint — app, web, subscription, refund — and ties it to real revenue. It moves you from raw measurement to data-driven decision-making that keeps your marketing strategy aligned and confident.
Campaignswell delivers exactly that: a multi-touch attribution model powered by predictive analytics. It integrates MMP signals, marketing attribution modeling, and real financial data into one reliable truth layer that aligns marketing, BI, and finance.
That’s what makes it the best attribution model for modern growth teams, one that doesn’t just show performance but predicts it.
Who really needs advanced marketing attribution modeling
Not every team feels the pain of attribution gaps right away. If you’re early-stage, running small marketing campaigns and still testing marketing channels, your MMP might cover most of what you need.
But as spend grows and funnels evolve into multi-step customer journeys, cracks start to show.
- Once you add web-to-app flows, subscriptions, or cross-platform engagement, you need more than a single-source dashboard, you need multi touch attribution and connected attribution data that reflect real revenue.
- UA leads managing six-figure budgets across Meta, TikTok, Snap, or DSPs know this moment well. They’re the ones asking which campaigns and creatives actually drive profit, not just installs.
- Growth teams responsible for marketing strategy that spans web signups, app installs, and subscription activations need one layer of truth across the entire journey — attribution modeling that unites performance and profit.
- CMOs and performance directors overseeing $50K–$500K in monthly or daily spend also hit this wall fast. Even a small reporting mismatch in marketing attribution modeling can distort data-driven decision-making and lead to hundreds of thousands in lost ROI.
If you’ve ever stared at a dashboard and thought, “the numbers don’t add up,” you’re already past the point where attribution alone is enough.
That’s the point where Campaignswell stops being a nice add-on and becomes the backbone of data-driven, connected growth.
Your MMP shows installs. We show profit. Schedule a demo.
Your MMP shows installs. We show profit.

Co-founder & CEO at Campaignswell
Book a demo


Co-founder at Campaignswell
Use the session to ask your hardest questions about scaling, LTV, or attribution, and see how full-funnel predictive analytics gives you clear, actionable answers.
Why your Subscription App can’t break the $100K/Month ceiling without losing revenue


71 takeaways mobile app publishers can use to improve monetization strategy and LTV

10 monetization mistakes that hold back subscription apps